Pottery Barn 2013 Annual Report Download - page 54
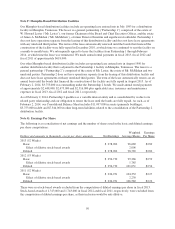
Download and view the complete annual report
Please find page 54 of the 2013 Pottery Barn annual report below. You can navigate through the pages in the report by either clicking on the pages listed below, or by using the keyword search tool below to find specific information within the annual report.-
 1
1 -
2
-
3
-
4
-
5
-
6
-
7
-
8
-
9
-
10
-
11
-
12
-
13
-
14
-
15
-
16
-
17
-
18
-
19
-
20
-
21
-
22
-
23
-
24
-
25
-
26
-
27
-
28
-
29
-
30
-
31
-
32
-
33
-
34
-
35
-
36
-
37
-
38
-
39
-
40
-
41
-
42
-
43
-
 44
44 -
 45
45 -
 46
46 -
 47
47 -
 48
48 -
 49
49 -
 50
50 -
 51
51 -
 52
52 -
 53
53 -
 54
54 -
 55
55 -
 56
56 -
 57
57 -
 58
58 -
 59
59 -
 60
60 -
 61
61 -
 62
62 -
 63
63 -
 64
64 -
65
-
66
-
67
-
68
-
69
-
70
-
71
-
72
-
73
-
74
-
75
-
76
-
77
-
78
-
79
-
80
-
81
-
82
-
83
-
84
-
85
-
86
-
87
-
88
-
89
-
90
-
91
-
92
-
93
-
94
-
95
-
96
-
97
-
98
-
99
-
100
-
101
-
102
-
103
-
104
-
105
-
106
-
107
-
108
-
109
-
110
-
111
-
112
-
113
-
114
-
115
-
116
-
117
-
118
-
119
-
120
-
121
-
122
-
123
-
124
-
125
-
126
-
127
-
128
-
129
-
130
-
131
-
132
-
133
-
134
-
135
-
136
-
137
-
138
-
139
-
140
-
141
-
142
-
143
-
144
-
145
-
146
-
147
-
148
-
149
-
150
-
151
-
152
-
153
-
154
-
155
-
156
 |
 |

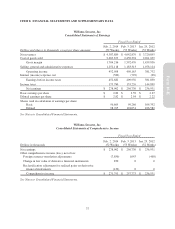
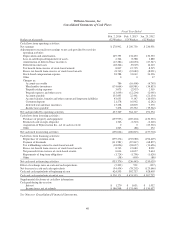
Williams-Sonoma, Inc.
Consolidated Statements of Cash Flows
Fiscal Year Ended
Dollars in thousands
Feb. 2, 2014
(52 Weeks)
Feb. 3, 2013
(53 Weeks)
Jan. 29, 2012
(52 Weeks)
Cash flows from operating activities:
Net earnings $ 278,902 $ 256,730 $ 236,931
Adjustments to reconcile net earnings to net cash provided by (used in)
operating activities:
Depreciation and amortization 149,795 134,453 130,553
Loss on sale/disposal/impairment of assets 2,764 8,388 2,880
Amortization of deferred lease incentives (25,382) (26,694) (27,547)
Deferred income taxes (28,344) (9,029) 14,210
Tax benefit from exercise of stock-based awards 8,817 12,725 8,515
Excess tax benefit from exercise of stock-based awards (8,743) (12,683) (8,021)
Stock-based compensation expense 38,788 31,042 24,336
Other 0017
Changes in:
Accounts receivable 786 (16,408) (4,763)
Merchandise inventories (174,664) (85,981) (34,853)
Prepaid catalog expenses 3,675 (2,937) 2,559
Prepaid expenses and other assets (13,649) (12,204) (2,065)
Accounts payable 135,095 22,461 (21,154)
Accrued salaries, benefits and other current and long-term liabilities 43,635 9,147 (16,030)
Customer deposits 21,578 16,962 (2,242)
Deferred rent and lease incentives 13,238 18,803 7,570
Income taxes payable 7,478 19,352 (19,562)
Net cash provided by operating activities 453,769 364,127 291,334
Cash flows from investing activities:
Purchases of property and equipment (193,953) (205,404) (130,353)
Restricted cash receipts (deposits) 1,766 (1,323) (2,220)
Acquisition of Rejuvenation Inc., net of cash received 0 0 (25,363)
Other 1,563 (88) 232
Net cash used in investing activities (190,624) (206,815) (157,704)
Cash flows from financing activities:
Repurchase of common stock (239,274) (155,080) (194,429)
Payment of dividends (111,581) (87,847) (68,877)
Tax withholdings related to stock-based awards (18,096) (18,637) (11,656)
Excess tax benefit from exercise of stock-based awards 8,743 12,683 8,021
Net proceeds from exercise of stock-based awards 6,614 14,637 9,614
Repayments of long-term obligations (1,724) (1,796) (1,626)
Other (58) (405) (86)
Net cash used in financing activities (355,376) (236,445) (259,039)
Effect of exchange rates on cash and cash equivalents (2,203) 931 (237)
Net decrease in cash and cash equivalents (94,434) (78,202) (125,646)
Cash and cash equivalents at beginning of year 424,555 502,757 628,403
Cash and cash equivalents at end of year $ 330,121 $ 424,555 $ 502,757
Supplemental disclosure of cash flow information:
Cash paid during the year for:
Interest $ 1,270 $ 1,651 $ 1,952
Income taxes, net of refunds $ 186,968 $ 131,440 $ 150,657
See Notes to Consolidated Financial Statements.
40