Pottery Barn 2013 Annual Report Download - page 42
Download and view the complete annual report
Please find page 42 of the 2013 Pottery Barn annual report below. You can navigate through the pages in the report by either clicking on the pages listed below, or by using the keyword search tool below to find specific information within the annual report.-
 1
1 -
2
-
3
-
4
-
5
-
6
-
7
-
8
-
9
-
10
-
11
-
12
-
13
-
14
-
15
-
16
-
17
-
18
-
19
-
20
-
21
-
22
-
23
-
24
-
25
-
26
-
27
-
28
-
29
-
30
-
31
-
 32
32 -
 33
33 -
 34
34 -
 35
35 -
 36
36 -
 37
37 -
 38
38 -
 39
39 -
 40
40 -
 41
41 -
 42
42 -
 43
43 -
 44
44 -
 45
45 -
 46
46 -
 47
47 -
 48
48 -
 49
49 -
 50
50 -
 51
51 -
 52
52 -
53
-
54
-
55
-
56
-
57
-
58
-
59
-
60
-
61
-
62
-
63
-
64
-
65
-
66
-
67
-
68
-
69
-
70
-
71
-
72
-
73
-
74
-
75
-
76
-
77
-
78
-
79
-
80
-
81
-
82
-
83
-
84
-
85
-
86
-
87
-
88
-
89
-
90
-
91
-
92
-
93
-
94
-
95
-
96
-
97
-
98
-
99
-
100
-
101
-
102
-
103
-
104
-
105
-
106
-
107
-
108
-
109
-
110
-
111
-
112
-
113
-
114
-
115
-
116
-
117
-
118
-
119
-
120
-
121
-
122
-
123
-
124
-
125
-
126
-
127
-
128
-
129
-
130
-
131
-
132
-
133
-
134
-
135
-
136
-
137
-
138
-
139
-
140
-
141
-
142
-
143
-
144
-
145
-
146
-
147
-
148
-
149
-
150
-
151
-
152
-
153
-
154
-
155
-
156
 |
 |

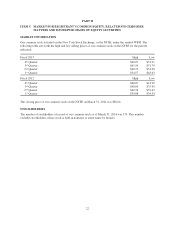
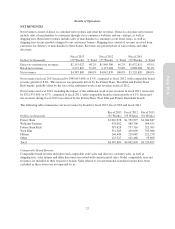
Comparable stores are defined as permanent stores in which gross square footage did not change by more than
20% in the previous 12 months and which have been open for at least 12 consecutive months without closure for
seven or more consecutive days.
Comparable brand revenue growth (decline)
Fiscal 2013
(52 Weeks)
Fiscal 2012
(53 Weeks)
Fiscal 2011
(52 Weeks)
Pottery Barn 10.4% 8.5% 7.6%
Williams-Sonoma 1.5% (1.7%) (0.3%)
Pottery Barn Kids 7.8% 5.6% 7.4%
West Elm 17.4% 17.4% 30.3%
PBteen 14.1% 1.7% 7.4%
Total 8.8% 6.1% 7.3%
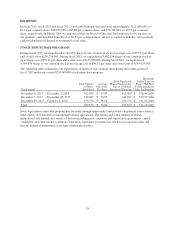
DIRECT-TO-CUSTOMER NET REVENUES
Dollars in thousands
Fiscal 2013
(52 Weeks)
Fiscal 2012
(53 Weeks)
Fiscal 2011
(52 Weeks)
Direct-to-customer net revenues $2,115,022 $1,869,386 $1,632,811
Direct-to-customer net revenue growth 13.1% 14.5% 12.4%
Direct-to-customer net revenues in fiscal 2013 increased by $245,636,000, or 13.1%, compared to fiscal 2012,
with growth across all brands, primarily led by Pottery Barn, West Elm, Pottery Barn Kids and PBteen, partially
offset by the loss of the additional week of net revenues in fiscal 2012.
Direct-to-customer net revenues in fiscal 2012, including the impact of the additional week of net revenues in
fiscal 2012, increased by $236,575,000, or 14.5%, compared to fiscal 2011. This increase was driven by growth
across all brands, led by Pottery Barn, West Elm, Pottery Barn Kids and Williams-Sonoma.
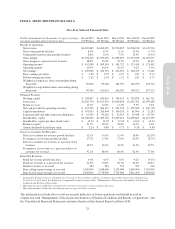
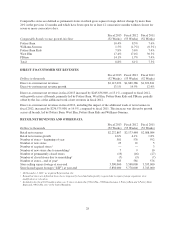
RETAIL NET REVENUES AND OTHER DATA
Dollars in thousands
Fiscal 2013
(52 Weeks)
Fiscal 2012
(53 Weeks)
Fiscal 2011
(52 Weeks)
Retail net revenues $2,272,867 $2,173,484 $2,088,084
Retail net revenue growth 4.6% 4.1% 1.8%
Number of stores – beginning of year 581 576 592
Number of new stores 23 21 5
Number of acquired stores1—— 3
Number of new stores due to remodeling27910
Number of permanently closed stores (19) (16) (27)
Number of closed stores due to remodeling2(7) (9) (7)
Number of stores – end of year3585 581 576
Store selling square footage at year-end 3,590,000 3,548,000 3,535,000
Store leased square footage (“LSF”) at year-end 5,838,000 5,778,000 5,743,000
1On November 1, 2011, we acquired Rejuvenation, Inc.
2Remodeled stores are defined as those stores temporarily closed and subsequently reopened due to square footage expansion, store
modification or relocation.
3Included in the fiscal 2013 numbers above are 5 stores in Australia (2 West Elm, 1 Williams-Sonoma, 1 Pottery Barn and 1 Pottery Barn
Kids) and 1 West Elm store in the United Kingdom.
28