Pottery Barn 2013 Annual Report Download - page 45
Download and view the complete annual report
Please find page 45 of the 2013 Pottery Barn annual report below. You can navigate through the pages in the report by either clicking on the pages listed below, or by using the keyword search tool below to find specific information within the annual report.-
 1
1 -
2
-
3
-
4
-
5
-
6
-
7
-
8
-
9
-
10
-
11
-
12
-
13
-
14
-
15
-
16
-
17
-
18
-
19
-
20
-
21
-
22
-
23
-
24
-
25
-
26
-
27
-
28
-
29
-
30
-
31
-
32
-
33
-
34
-
 35
35 -
 36
36 -
 37
37 -
 38
38 -
 39
39 -
 40
40 -
 41
41 -
 42
42 -
 43
43 -
 44
44 -
 45
45 -
 46
46 -
 47
47 -
 48
48 -
 49
49 -
 50
50 -
 51
51 -
 52
52 -
 53
53 -
 54
54 -
 55
55 -
56
-
57
-
58
-
59
-
60
-
61
-
62
-
63
-
64
-
65
-
66
-
67
-
68
-
69
-
70
-
71
-
72
-
73
-
74
-
75
-
76
-
77
-
78
-
79
-
80
-
81
-
82
-
83
-
84
-
85
-
86
-
87
-
88
-
89
-
90
-
91
-
92
-
93
-
94
-
95
-
96
-
97
-
98
-
99
-
100
-
101
-
102
-
103
-
104
-
105
-
106
-
107
-
108
-
109
-
110
-
111
-
112
-
113
-
114
-
115
-
116
-
117
-
118
-
119
-
120
-
121
-
122
-
123
-
124
-
125
-
126
-
127
-
128
-
129
-
130
-
131
-
132
-
133
-
134
-
135
-
136
-
137
-
138
-
139
-
140
-
141
-
142
-
143
-
144
-
145
-
146
-
147
-
148
-
149
-
150
-
151
-
152
-
153
-
154
-
155
-
156
 |
 |

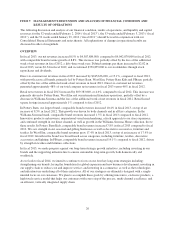
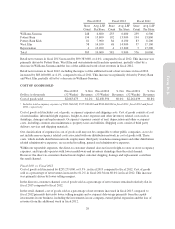
higher employment costs, including employee separation charges, and increases in other expenses resulting from
planned incremental investments to support e-commerce, global expansion and business development growth
strategies, partially offset by greater advertising efficiency.
In the direct-to-customer channel, selling, general and administrative expenses as a percentage of net revenues
decreased in fiscal 2012 compared to fiscal 2011. This decrease was primarily driven by greater advertising
efficiency.
In the retail channel, selling, general and administrative expenses as a percentage of net revenues increased in
fiscal 2012 compared to fiscal 2011. This increase was primarily driven by higher employment costs.
INCOME TAXES
Our effective income tax rate was 38.4% for fiscal 2013, 37.4% for fiscal 2012, and 37.9% for fiscal 2011. The
increase in the effective income tax rate in fiscal 2013 over fiscal 2012 was primarily driven by certain favorable
income tax resolutions and credits in fiscal 2012.
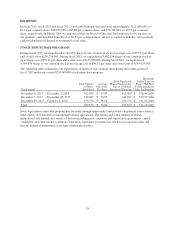
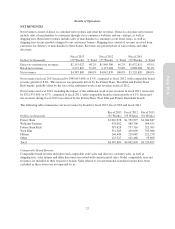
LIQUIDITY AND CAPITAL RESOURCES
As of February 2, 2014, we held $330,121,000 in cash and cash equivalent funds, the majority of which is held in
money market funds, interest-bearing demand deposit accounts and time deposits, of which $95,942,000 was
held by our foreign subsidiaries. As is consistent within our industry, our cash balances are seasonal in nature,
with the fourth quarter historically representing a significantly higher level of cash than other periods.
Throughout the fiscal year, we utilize our cash balances to build our inventory levels in preparation for our fourth
quarter holiday sales. In fiscal 2014, we plan to use our cash resources to fund our inventory and inventory
related purchases, advertising and marketing initiatives, stock repurchases and dividend payments and purchases
of property and equipment. In addition to the current cash balances on hand, we have a credit facility that
provides for a $300,000,000 unsecured revolving line of credit that may be used for loans or letters of credit.
Prior to December 22, 2016, we may, upon notice to the lenders, request an increase in the credit facility of up to
$200,000,000 to provide for a total of $500,000,000 of unsecured revolving credit. During fiscal 2013 and fiscal
2012, we had no borrowings under the credit facility, and no amounts were outstanding as of February 2, 2014 or
February 3, 2013. However, as of February 2, 2014, $3,070,000 in issued but undrawn standby letters of credit
was outstanding under the credit facility. Additionally, as of February 2, 2014, we had three unsecured letter of
credit reimbursement facilities for a total of $70,000,000, of which an aggregate of $15,283,000 was outstanding.
These letter of credit facilities represent only a future commitment to fund inventory purchases to which we had
not taken legal title. We are currently in compliance with all of our financial covenants and, based on our current
projections, we expect to remain in compliance throughout fiscal 2014. We believe our cash on hand, in addition
to our available credit facilities, will provide adequate liquidity for our business operations over the next
12 months.
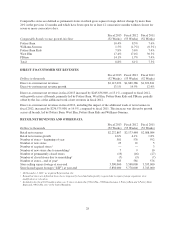
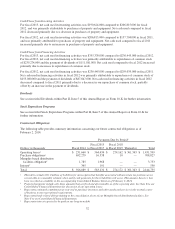
Cash Flows from Operating Activities
For fiscal 2013, net cash provided by operating activities was $453,769,000 compared to $364,127,000 in fiscal
2012. For fiscal 2013, net cash provided by operating activities was primarily attributable to an increase in net
earnings adjusted for non-cash items and an increase in accounts payable and accrued liabilities, partially offset
by an increase in merchandise inventories. This represents an increase in net cash provided compared to fiscal
2012 primarily due to the timing of payments associated with accounts payable and accrued liabilities, partially
offset by an increase in inventory purchases.
In fiscal 2012, net cash provided by operating activities was $364,127,000 compared to $291,334,000 in fiscal
2011. Net cash provided by operating activities in fiscal 2012 was primarily attributable to net earnings adjusted
for non-cash items and an increase in accounts payable, partially offset by an increase in merchandise
inventories. Net cash provided by operating activities in fiscal 2012 increased compared to fiscal 2011 primarily
due to the timing of payments associated with accounts payable and accrued salaries, benefits and other
expenses, and an increase in income taxes payable and customer deposits, partially offset by an increase in
inventory purchases.
31
Form 10-K