Pottery Barn 2013 Annual Report Download - page 53
Download and view the complete annual report
Please find page 53 of the 2013 Pottery Barn annual report below. You can navigate through the pages in the report by either clicking on the pages listed below, or by using the keyword search tool below to find specific information within the annual report.-
 1
1 -
2
-
3
-
4
-
5
-
6
-
7
-
8
-
9
-
10
-
11
-
12
-
13
-
14
-
15
-
16
-
17
-
18
-
19
-
20
-
21
-
22
-
23
-
24
-
25
-
26
-
27
-
28
-
29
-
30
-
31
-
32
-
33
-
34
-
35
-
36
-
37
-
38
-
39
-
40
-
41
-
42
-
 43
43 -
 44
44 -
 45
45 -
 46
46 -
 47
47 -
 48
48 -
 49
49 -
 50
50 -
 51
51 -
 52
52 -
 53
53 -
 54
54 -
 55
55 -
 56
56 -
 57
57 -
 58
58 -
 59
59 -
 60
60 -
 61
61 -
 62
62 -
 63
63 -
64
-
65
-
66
-
67
-
68
-
69
-
70
-
71
-
72
-
73
-
74
-
75
-
76
-
77
-
78
-
79
-
80
-
81
-
82
-
83
-
84
-
85
-
86
-
87
-
88
-
89
-
90
-
91
-
92
-
93
-
94
-
95
-
96
-
97
-
98
-
99
-
100
-
101
-
102
-
103
-
104
-
105
-
106
-
107
-
108
-
109
-
110
-
111
-
112
-
113
-
114
-
115
-
116
-
117
-
118
-
119
-
120
-
121
-
122
-
123
-
124
-
125
-
126
-
127
-
128
-
129
-
130
-
131
-
132
-
133
-
134
-
135
-
136
-
137
-
138
-
139
-
140
-
141
-
142
-
143
-
144
-
145
-
146
-
147
-
148
-
149
-
150
-
151
-
152
-
153
-
154
-
155
-
156
 |
 |

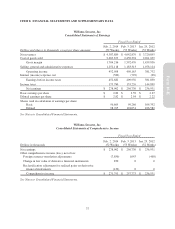
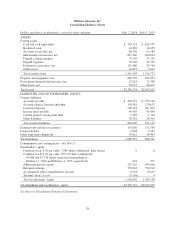
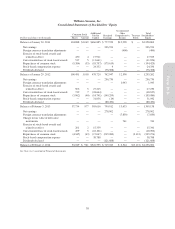
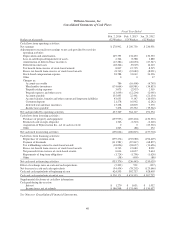
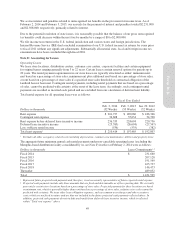
Williams-Sonoma, Inc.
Consolidated Statements of Stockholders’ Equity
Common Stock Additional
Paid-in
Capital
Retained
Earnings
Accumulated
Other
Comprehensive
Income
Treasury
Stock
Total
Stockholders’
EquityDollars and shares in thousands Shares Amount
Balance at January 30, 2011 104,888 $1,049 $466,885 $ 777,939 $12,990 $ — $1,258,863
Net earnings — — — 236,931 — — 236,931
Foreign currency translation adjustments — — — — (400) — (400)
Exercise of stock-based awards and
related tax effect 430 4 17,921 — — — 17,925
Conversion/release of stock-based awards 517 5 (11,661) — — — (11,656)
Repurchases of common stock (5,384) (53) (18,757) (175,619) — — (194,429)
Stock-based compensation expense — — 24,332 4 — — 24,336
Dividends declared — — — (76,308) — — (76,308)
Balance at January 29, 2012 100,451 1,005 478,720 762,947 12,590 — 1,255,262
Net earnings — — — 256,730 — — 256,730
Foreign currency translation adjustments — — — — 1,043 — 1,043
Exercise of stock-based awards and
related tax effect 506 5 27,225 — — — 27,230
Conversion/release of stock-based awards 739 7 (18,644) — — — (18,637)
Repurchases of common stock (3,962) (40) (14,741) (140,299) — — (155,080)
Stock-based compensation expense — — 31,056 (14) — — 31,042
Dividends declared — — — (88,452) — — (88,452)
Balance at February 3, 2013 97,734 977 503,616 790,912 13,633 — 1,309,138
Net earnings — — — 278,902 — — 278,902
Foreign currency translation adjustments — — — — (7,850) — (7,850)
Change in fair value of derivative
instruments — — — — 741 — 741
Exercise of stock-based awards and
related tax effect 201 2 15,339 — — — 15,341
Conversion/release of stock-based awards 459 5 (18,101) — — — (18,096)
Repurchases of common stock (4,345) (43) (17,047) (219,083) — (3,101) (239,274)
Stock-based compensation expense — — 38,788 — — — 38,788
Dividends declared — — — (121,688) — — (121,688)
Balance at February 2, 2014 94,049 $ 941 $522,595 $ 729,043 $ 6,524 $(3,101) $1,256,002
See Notes to Consolidated Financial Statements.
39
Form 10-K