Pottery Barn 2013 Annual Report Download - page 121
Download and view the complete annual report
Please find page 121 of the 2013 Pottery Barn annual report below. You can navigate through the pages in the report by either clicking on the pages listed below, or by using the keyword search tool below to find specific information within the annual report.-
 1
1 -
2
-
3
-
4
-
5
-
6
-
7
-
8
-
9
-
10
-
11
-
12
-
13
-
14
-
15
-
16
-
17
-
18
-
19
-
20
-
21
-
22
-
23
-
24
-
25
-
26
-
27
-
28
-
29
-
30
-
31
-
32
-
33
-
34
-
35
-
36
-
37
-
38
-
39
-
40
-
41
-
42
-
43
-
44
-
45
-
46
-
47
-
48
-
49
-
50
-
51
-
52
-
53
-
54
-
55
-
56
-
57
-
58
-
59
-
60
-
61
-
62
-
63
-
64
-
65
-
66
-
67
-
68
-
69
-
70
-
71
-
72
-
73
-
74
-
75
-
76
-
77
-
78
-
79
-
80
-
81
-
82
-
83
-
84
-
85
-
86
-
87
-
88
-
89
-
90
-
91
-
92
-
93
-
94
-
95
-
96
-
97
-
98
-
99
-
100
-
101
-
102
-
103
-
104
-
105
-
106
-
107
-
108
-
109
-
110
-
 111
111 -
 112
112 -
 113
113 -
 114
114 -
 115
115 -
 116
116 -
 117
117 -
 118
118 -
 119
119 -
 120
120 -
 121
121 -
 122
122 -
 123
123 -
 124
124 -
 125
125 -
 126
126 -
 127
127 -
 128
128 -
 129
129 -
 130
130 -
 131
131 -
132
-
133
-
134
-
135
-
136
-
137
-
138
-
139
-
140
-
141
-
142
-
143
-
144
-
145
-
146
-
147
-
148
-
149
-
150
-
151
-
152
-
153
-
154
-
155
-
156
 |
 |
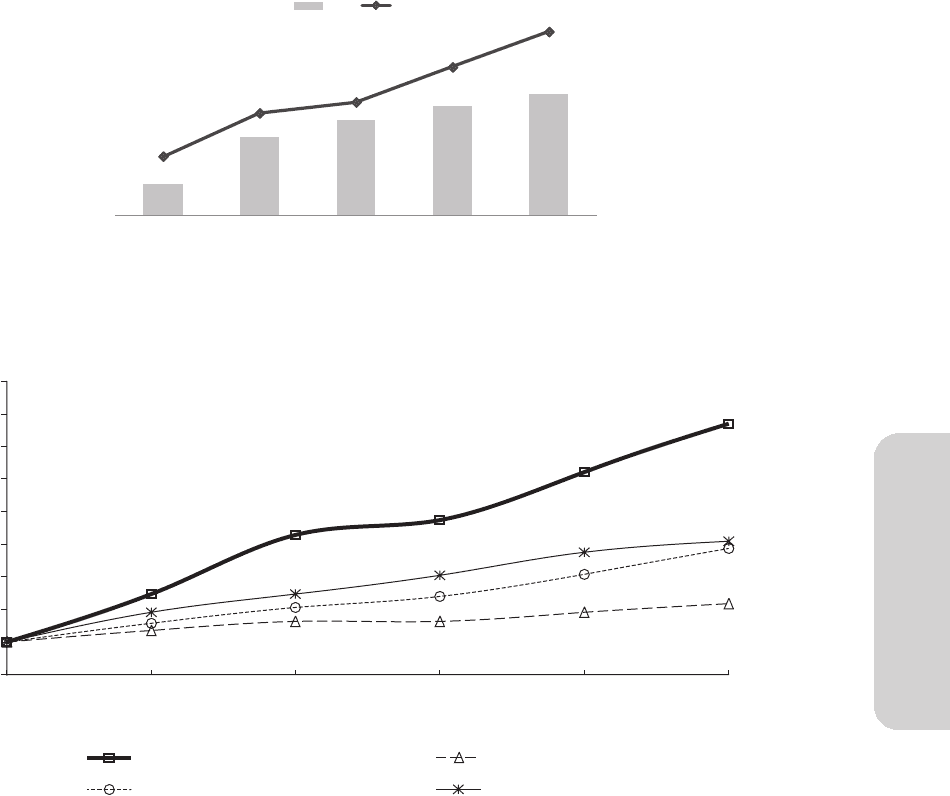
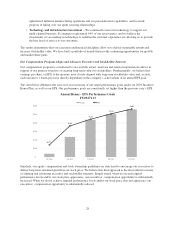
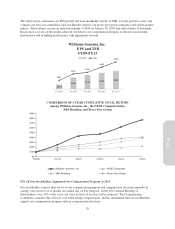
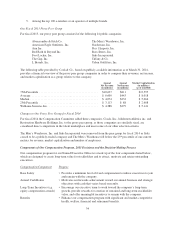
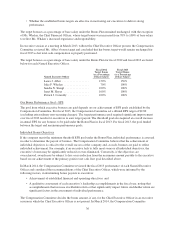
The charts below summarize our EPS growth and total stockholder return, or TSR, over the past five years, and
compare our five-year cumulative total stockholder return to our proxy peer group companies and certain market
indices. These returns assume an initial investment of $100 on January 30, 2009 and reinvestment of dividends.
Based upon a review of the results achieved, we believe our compensation program is effective in incenting
performance and in linking performance with appropriate rewards.
$0.72
$1.83 $2.22 $2.54 $2.82
$247
$429 $474
$622
$770
FY 2009 FY 2010 FY 2011 FY 2012 FY 2013
Williams-Sonoma, Inc.
EPS and TSR
FY09-FY13
EPS TSR
COMPARISON OF 5 YEAR CUMULATIVE TOTAL RETURN
Among Williams-Sonoma, Inc., the NYSE Composite Index,
S&P Retailing, and Proxy Peer Group
1/30/09 1/31/10 1/30/11 1/29/12 2/3/13 2/2/14
$0
$100
$200
$300
$400
$500
$600
$700
$800
$900
Williams−Sonoma, Inc. NYSE Composite
S&P Retailing Proxy Peer Group
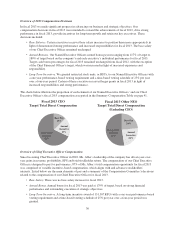
92% Of Our Stockholders Supported Our Compensation Program in 2013
Our stockholders express their views on our compensation program and compensation decisions annually by
casting votes in favor of or against our annual Say on Pay proposal. At the 2013 Annual Meeting of
Stockholders, over 92% of the votes cast were in favor of our Say on Pay proposal. The Compensation
Committee considers this advisory vote when setting compensation, and has determined that our stockholders
support our compensation program and our compensation decisions.
29
Proxy