Pottery Barn 2013 Annual Report Download - page 41
Download and view the complete annual report
Please find page 41 of the 2013 Pottery Barn annual report below. You can navigate through the pages in the report by either clicking on the pages listed below, or by using the keyword search tool below to find specific information within the annual report.-
 1
1 -
2
-
3
-
4
-
5
-
6
-
7
-
8
-
9
-
10
-
11
-
12
-
13
-
14
-
15
-
16
-
17
-
18
-
19
-
20
-
21
-
22
-
23
-
24
-
25
-
26
-
27
-
28
-
29
-
30
-
 31
31 -
 32
32 -
 33
33 -
 34
34 -
 35
35 -
 36
36 -
 37
37 -
 38
38 -
 39
39 -
 40
40 -
 41
41 -
 42
42 -
 43
43 -
 44
44 -
 45
45 -
 46
46 -
 47
47 -
 48
48 -
 49
49 -
 50
50 -
 51
51 -
52
-
53
-
54
-
55
-
56
-
57
-
58
-
59
-
60
-
61
-
62
-
63
-
64
-
65
-
66
-
67
-
68
-
69
-
70
-
71
-
72
-
73
-
74
-
75
-
76
-
77
-
78
-
79
-
80
-
81
-
82
-
83
-
84
-
85
-
86
-
87
-
88
-
89
-
90
-
91
-
92
-
93
-
94
-
95
-
96
-
97
-
98
-
99
-
100
-
101
-
102
-
103
-
104
-
105
-
106
-
107
-
108
-
109
-
110
-
111
-
112
-
113
-
114
-
115
-
116
-
117
-
118
-
119
-
120
-
121
-
122
-
123
-
124
-
125
-
126
-
127
-
128
-
129
-
130
-
131
-
132
-
133
-
134
-
135
-
136
-
137
-
138
-
139
-
140
-
141
-
142
-
143
-
144
-
145
-
146
-
147
-
148
-
149
-
150
-
151
-
152
-
153
-
154
-
155
-
156
 |
 |

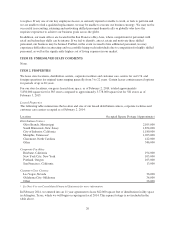
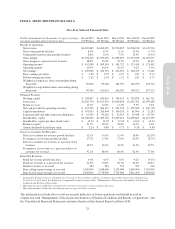
Results of Operations
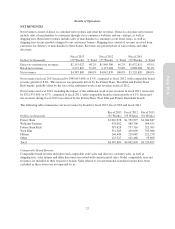
NET REVENUES
Net revenues consist of direct-to-customer net revenues and retail net revenues. Direct-to-customer net revenues
include sales of merchandise to customers through our e-commerce websites and our catalogs, as well as
shipping fees. Retail net revenues include sales of merchandise to customers at our retail stores, as well as
shipping fees on any products shipped to our customers’ homes. Shipping fees consist of revenue received from
customers for delivery of merchandise to their homes. Revenues are presented net of sales returns and other
discounts.
Dollars in thousands
Fiscal 2013
(52 Weeks) % Total
Fiscal 2012
(53 Weeks) % Total
Fiscal 2011
(52 Weeks) % Total
Direct-to-customer net revenues $2,115,022 48.2% $1,869,386 46.2% $1,632,811 43.9%
Retail net revenues 2,272,867 51.8% 2,173,484 53.8% 2,088,084 56.1%
Net revenues $4,387,889 100.0% $4,042,870 100.0% $3,720,895 100.0%
Net revenues in fiscal 2013 increased by $345,019,000, or 8.5%, compared to fiscal 2012, with comparable brand
revenue growth of 8.8%. This increase was primarily driven by the Pottery Barn, West Elm and Pottery Barn
Kids brands, partially offset by the loss of the additional week of net revenues in fiscal 2012.
Net revenues in fiscal 2012, including the impact of the additional week of net revenues in fiscal 2012, increased
by $321,975,000, or 8.7%, compared to fiscal 2011, with comparable brand revenue growth of 6.1%. Increased
net revenues during fiscal 2012 were driven by the Pottery Barn, West Elm and Pottery Barn Kids brands.
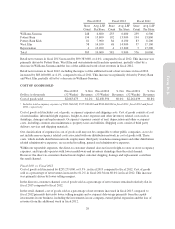
The following table summarizes our net revenues by brand for fiscal 2013, fiscal 2012 and fiscal 2011.
Dollars in thousands
Fiscal 2013
(52 Weeks)
Fiscal 2012
(53 Weeks)
Fiscal 2011
(52 Weeks)
Pottery Barn $1,910,978 $1,752,997 $1,600,847
Williams-Sonoma 978,002 980,709 994,425
Pottery Barn Kids 597,628 557,516 521,565
West Elm 531,305 430,099 335,980
PBteen 246,449 220,081 212,270
Other 123,527 101,468 55,808
Total $4,387,889 $4,042,870 $3,720,895
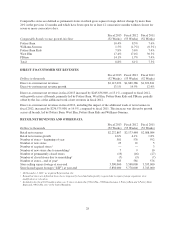
Comparable Brand Revenue
Comparable brand revenue includes retail comparable store sales and direct-to-customer sales, as well as
shipping fees, sales returns and other discounts associated with current period sales. Outlet comparable store net
revenues are included in their respective brands. Sales related to our international franchised stores have been
excluded as these stores are not operated by us.
27
Form 10-K