Pottery Barn 2013 Annual Report Download - page 51
Download and view the complete annual report
Please find page 51 of the 2013 Pottery Barn annual report below. You can navigate through the pages in the report by either clicking on the pages listed below, or by using the keyword search tool below to find specific information within the annual report.-
 1
1 -
2
-
3
-
4
-
5
-
6
-
7
-
8
-
9
-
10
-
11
-
12
-
13
-
14
-
15
-
16
-
17
-
18
-
19
-
20
-
21
-
22
-
23
-
24
-
25
-
26
-
27
-
28
-
29
-
30
-
31
-
32
-
33
-
34
-
35
-
36
-
37
-
38
-
39
-
40
-
 41
41 -
 42
42 -
 43
43 -
 44
44 -
 45
45 -
 46
46 -
 47
47 -
 48
48 -
 49
49 -
 50
50 -
 51
51 -
 52
52 -
 53
53 -
 54
54 -
 55
55 -
 56
56 -
 57
57 -
 58
58 -
 59
59 -
 60
60 -
 61
61 -
62
-
63
-
64
-
65
-
66
-
67
-
68
-
69
-
70
-
71
-
72
-
73
-
74
-
75
-
76
-
77
-
78
-
79
-
80
-
81
-
82
-
83
-
84
-
85
-
86
-
87
-
88
-
89
-
90
-
91
-
92
-
93
-
94
-
95
-
96
-
97
-
98
-
99
-
100
-
101
-
102
-
103
-
104
-
105
-
106
-
107
-
108
-
109
-
110
-
111
-
112
-
113
-
114
-
115
-
116
-
117
-
118
-
119
-
120
-
121
-
122
-
123
-
124
-
125
-
126
-
127
-
128
-
129
-
130
-
131
-
132
-
133
-
134
-
135
-
136
-
137
-
138
-
139
-
140
-
141
-
142
-
143
-
144
-
145
-
146
-
147
-
148
-
149
-
150
-
151
-
152
-
153
-
154
-
155
-
156
 |
 |

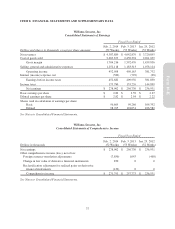
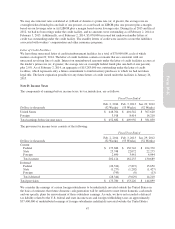
ITEM 8. FINANCIAL STATEMENTS AND SUPPLEMENTARY DATA
Williams-Sonoma, Inc.
Consolidated Statements of Earnings
Fiscal Year Ended
Dollars and shares in thousands, except per share amounts
Feb. 2, 2014
(52 Weeks)
Feb. 3, 2013
(53 Weeks)
Jan. 29, 2012
(52 Weeks)
Net revenues $ 4,387,889 $ 4,042,870 $ 3,720,895
Cost of goods sold 2,683,673 2,450,394 2,261,039
Gross margin 1,704,216 1,592,476 1,459,856
Selling, general and administrative expenses 1,252,118 1,183,313 1,078,124
Operating income 452,098 409,163 381,732
Interest (income) expense, net (584) (793) (98)
Earnings before income taxes 452,682 409,956 381,830
Income taxes 173,780 153,226 144,899
Net earnings $ 278,902 $ 256,730 $ 236,931
Basic earnings per share $ 2.89 $ 2.59 $ 2.27
Diluted earnings per share $ 2.82 $ 2.54 $ 2.22
Shares used in calculation of earnings per share:
Basic 96,669 99,266 104,352
Diluted 98,765 101,051 106,582
See Notes to Consolidated Financial Statements.
Williams-Sonoma, Inc.
Consolidated Statements of Comprehensive Income
Fiscal Year Ended
Dollars in thousands
Feb. 2, 2014
(52 Weeks)
Feb. 3, 2013
(53 Weeks)
Jan. 29, 2012
(52 Weeks)
Net earnings $ 278,902 $ 256,730 $ 236,931
Other comprehensive income (loss), net of tax:
Foreign currency translation adjustments (7,850) 1,043 (400)
Change in fair value of derivative financial instruments 870 0 0
Reclassification adjustment for realized gains on derivative
financial instruments (129) 0 0
Comprehensive income $ 271,793 $ 257,773 $ 236,531
See Notes to Consolidated Financial Statements.
37
Form 10-K