Pottery Barn 2013 Annual Report Download - page 40
Download and view the complete annual report
Please find page 40 of the 2013 Pottery Barn annual report below. You can navigate through the pages in the report by either clicking on the pages listed below, or by using the keyword search tool below to find specific information within the annual report.-
 1
1 -
2
-
3
-
4
-
5
-
6
-
7
-
8
-
9
-
10
-
11
-
12
-
13
-
14
-
15
-
16
-
17
-
18
-
19
-
20
-
21
-
22
-
23
-
24
-
25
-
26
-
27
-
28
-
29
-
 30
30 -
 31
31 -
 32
32 -
 33
33 -
 34
34 -
 35
35 -
 36
36 -
 37
37 -
 38
38 -
 39
39 -
 40
40 -
 41
41 -
 42
42 -
 43
43 -
 44
44 -
 45
45 -
 46
46 -
 47
47 -
 48
48 -
 49
49 -
 50
50 -
51
-
52
-
53
-
54
-
55
-
56
-
57
-
58
-
59
-
60
-
61
-
62
-
63
-
64
-
65
-
66
-
67
-
68
-
69
-
70
-
71
-
72
-
73
-
74
-
75
-
76
-
77
-
78
-
79
-
80
-
81
-
82
-
83
-
84
-
85
-
86
-
87
-
88
-
89
-
90
-
91
-
92
-
93
-
94
-
95
-
96
-
97
-
98
-
99
-
100
-
101
-
102
-
103
-
104
-
105
-
106
-
107
-
108
-
109
-
110
-
111
-
112
-
113
-
114
-
115
-
116
-
117
-
118
-
119
-
120
-
121
-
122
-
123
-
124
-
125
-
126
-
127
-
128
-
129
-
130
-
131
-
132
-
133
-
134
-
135
-
136
-
137
-
138
-
139
-
140
-
141
-
142
-
143
-
144
-
145
-
146
-
147
-
148
-
149
-
150
-
151
-
152
-
153
-
154
-
155
-
156
 |
 |
ITEM 7. MANAGEMENT’S DISCUSSION AND ANALYSIS OF FINANCIAL CONDITION AND
RESULTS OF OPERATIONS
The following discussion and analysis of our financial condition, results of operations, and liquidity and capital
resources for the 52 weeks ended February 2, 2014 (“fiscal 2013”), the 53 weeks ended February 3, 2013 (“fiscal
2012”), and the 52 weeks ended January 29, 2012 (“fiscal 2011”) should be read in conjunction with our
Consolidated Financial Statements and notes thereto. All explanations of changes in operational results are
discussed in order of magnitude.
OVERVIEW
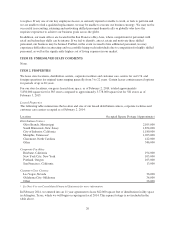
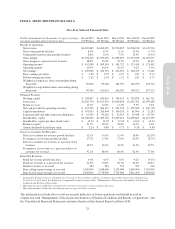
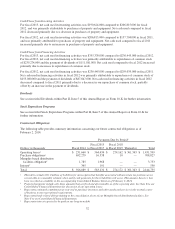
In fiscal 2013, our net revenues increased 8.5% to $4,387,889,000, compared to $4,042,870,000 in fiscal 2012,
with comparable brand revenue growth of 8.8%. This increase was partially offset by the loss of the additional
week of net revenues in fiscal 2012, a fifty-three week year. Diluted earnings per share increased to $2.82 in
fiscal 2013, versus $2.54 in fiscal 2012, and we returned $350,855,000 to our stockholders through stock
repurchases and dividends.
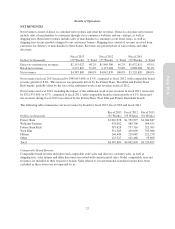
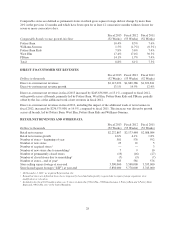
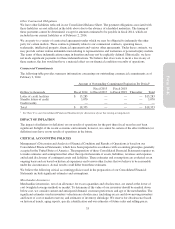
Direct-to-customer net revenues in fiscal 2013 increased by $245,636,000, or 13.1%, compared to fiscal 2012,
with growth across all brands, primarily led by Pottery Barn, West Elm, Pottery Barn Kids and PBteen, partially
offset by the loss of the additional week of net revenues in fiscal 2012. Direct-to-customer net revenues
generated approximately 48% of our total company net revenues in fiscal 2013 versus 46% in fiscal 2012.
Retail net revenues in fiscal 2013 increased by $99,383,000, or 4.6%, compared to fiscal 2012. This increase was
primarily driven by Pottery Barn, West Elm and our international franchise operations, partially offset by a
decrease in Williams-Sonoma and the loss of the additional week of net revenues in fiscal 2012. Retail leased
square footage increased approximately 1% compared to fiscal 2012.
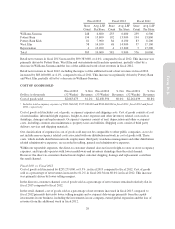
In Pottery Barn, our largest brand, comparable brand revenues increased 10.4% in fiscal 2013, on top of an
increase of 8.5% in fiscal 2012. This growth was driven by both channels and in all key categories. In the
Williams-Sonoma brand, comparable brand revenues increased 1.5% in fiscal 2013 compared to fiscal 2012.
Innovative products and newness, inspirational visual merchandising, a fresh approach to our store experience,
and continued strength in our direct channel, as well as growth in the Williams-Sonoma Home collection, drove
these results. In Pottery Barn Kids, comparable brand revenues increased 7.8% in fiscal 2013 compared to fiscal
2012. We saw strength in our seasonal and gifting businesses as well as decorative accessories, furniture and
textiles. In West Elm, comparable brand revenues grew 17.4% in fiscal 2013, on top of an increase of 17.4% in
fiscal 2012. Growth in the brand was broad-based across categories, including furniture, textiles, decorative
accessories and lighting. In PBteen, comparable brand revenues increased 14.1% compared to fiscal 2012, driven
by strength in textiles and furniture collections.
In fiscal 2013, we made progress against our long-term strategic growth initiatives, including investing in our
brands and the supporting infrastructure to ensure sustainable long-term growth, both domestically and
worldwide.
As we look to fiscal 2014, we intend to continue to focus on our four key long-term strategies including:
strengthening our brands; laying the foundation for global expansion and new business development; investing in
our supply chain to reduce cost and improve service; and investing in e-commerce, as well as the technologies
and infrastructure underlying all of these initiatives. All of our strategies are ultimately designed with a single-
minded focus on our customers. We plan to accomplish these goals by offering innovative, exclusive products, a
high touch service model that helps our customers with every step of the process, multi-channel excellence, and
an efficient, vertically integrated supply chain.
26