Pottery Barn 2013 Annual Report Download - page 44
Download and view the complete annual report
Please find page 44 of the 2013 Pottery Barn annual report below. You can navigate through the pages in the report by either clicking on the pages listed below, or by using the keyword search tool below to find specific information within the annual report.-
 1
1 -
2
-
3
-
4
-
5
-
6
-
7
-
8
-
9
-
10
-
11
-
12
-
13
-
14
-
15
-
16
-
17
-
18
-
19
-
20
-
21
-
22
-
23
-
24
-
25
-
26
-
27
-
28
-
29
-
30
-
31
-
32
-
33
-
 34
34 -
 35
35 -
 36
36 -
 37
37 -
 38
38 -
 39
39 -
 40
40 -
 41
41 -
 42
42 -
 43
43 -
 44
44 -
 45
45 -
 46
46 -
 47
47 -
 48
48 -
 49
49 -
 50
50 -
 51
51 -
 52
52 -
 53
53 -
 54
54 -
55
-
56
-
57
-
58
-
59
-
60
-
61
-
62
-
63
-
64
-
65
-
66
-
67
-
68
-
69
-
70
-
71
-
72
-
73
-
74
-
75
-
76
-
77
-
78
-
79
-
80
-
81
-
82
-
83
-
84
-
85
-
86
-
87
-
88
-
89
-
90
-
91
-
92
-
93
-
94
-
95
-
96
-
97
-
98
-
99
-
100
-
101
-
102
-
103
-
104
-
105
-
106
-
107
-
108
-
109
-
110
-
111
-
112
-
113
-
114
-
115
-
116
-
117
-
118
-
119
-
120
-
121
-
122
-
123
-
124
-
125
-
126
-
127
-
128
-
129
-
130
-
131
-
132
-
133
-
134
-
135
-
136
-
137
-
138
-
139
-
140
-
141
-
142
-
143
-
144
-
145
-
146
-
147
-
148
-
149
-
150
-
151
-
152
-
153
-
154
-
155
-
156
 |
 |

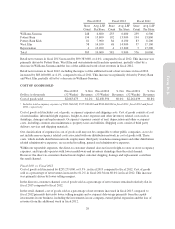
Fiscal 2012 vs. Fiscal 2011
Cost of goods sold increased by $189,355,000, or 8.4%, in fiscal 2012 compared to fiscal 2011. Cost of goods
sold as a percentage of net revenues decreased to 60.6% in fiscal 2012 from 60.8% in fiscal 2011. This decrease
was primarily driven by the leverage of fixed occupancy expenses due to increasing net revenues, partially offset
by lower selling margins.
In the direct-to-customer channel, cost of goods sold as a percentage of direct-to-customer net revenues increased
in fiscal 2012 compared to fiscal 2011. This increase as a percentage of net revenues was primarily driven by
lower selling margins, partially offset by the leverage of fixed occupancy expenses due to increasing net
revenues.
In the retail channel, cost of goods sold as a percentage of net revenues decreased in fiscal 2012 compared to
fiscal 2011. This decrease as a percentage of net revenues was primarily driven by the leverage of fixed
occupancy expenses.
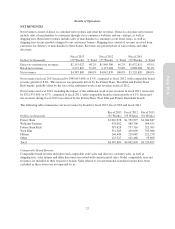
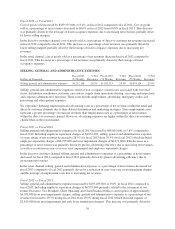
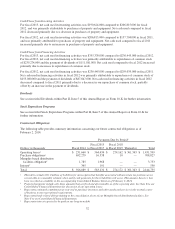
SELLING, GENERAL AND ADMINISTRATIVE EXPENSES
Dollars in thousands
Fiscal 2013
(52 Weeks)
% Net
Revenues
Fiscal 2012
(53 Weeks)
% Net
Revenues
Fiscal 2011
(52 Weeks)
% Net
Revenues
Selling, general and administrative expenses $1,252,118 28.5% $1,183,313 29.3% $1,078,124 29.0%
Selling, general and administrative expenses consist of non-occupancy related costs associated with our retail
stores, distribution warehouses, customer care centers, supply chain operations (buying, receiving and inspection)
and corporate administrative functions. These costs include employment, advertising, third party credit card
processing and other general expenses.
We experience differing employment and advertising costs as a percentage of net revenues within the retail and
direct-to-customer channels due to their distinct distribution and marketing strategies. Store employment costs
represent a greater percentage of retail net revenues than employment costs as a percentage of net revenues
within the direct-to-customer channel. However, advertising expenses are higher within the direct-to-customer
channel than in the retail channel.
Fiscal 2013 vs. Fiscal 2012
Selling, general and administrative expenses for fiscal 2013 increased by $68,805,000, or 5.8%, compared to
fiscal 2012. Including employee separation charges of $2,932,000, selling, general and administrative expenses
as a percentage of net revenues decreased to 28.5% for fiscal 2013 from 29.3% for fiscal 2012 (which included
employee separation charges of $6,935,000 and asset impairment charges of $6,071,000). This decrease as a
percentage of net revenues was primarily driven by greater advertising efficiency due to increasing net revenues,
as well as a reduction in year-over-year asset impairment and employee separation charges.
In the direct-to-customer channel, selling, general and administrative expenses as a percentage of net revenues
decreased for fiscal 2013 compared to fiscal 2012 primarily driven by greater advertising efficiency due to
increasing net revenues.
In the retail channel, selling, general and administrative expenses as a percentage of net revenues decreased for
fiscal 2013 compared to fiscal 2012 primarily driven by a reduction in year-over-year asset impairment charges
and the leverage of employment costs due to increasing net revenues.
Fiscal 2012 vs. Fiscal 2011
Selling, general and administrative expenses increased by $105,189,000, or 9.8%, in fiscal 2012 compared to
fiscal 2011. Including employee separation charges of $6,935,000 primarily related to the retirement of our
former Executive Vice President, Chief Operating and Chief Financial Officer, and expense of approximately
$6,071,000 from asset impairment charges, selling, general and administrative expenses as a percentage of net
revenues increased to 29.3% during fiscal 2012 from 29.0% during fiscal 2011 (which included expense of
$2,819,000 from asset impairment and early lease termination charges). This increase was primarily driven by
30