Pottery Barn 2013 Annual Report Download - page 37
Download and view the complete annual report
Please find page 37 of the 2013 Pottery Barn annual report below. You can navigate through the pages in the report by either clicking on the pages listed below, or by using the keyword search tool below to find specific information within the annual report.-
 1
1 -
2
-
3
-
4
-
5
-
6
-
7
-
8
-
9
-
10
-
11
-
12
-
13
-
14
-
15
-
16
-
17
-
18
-
19
-
20
-
21
-
22
-
23
-
24
-
25
-
26
-
 27
27 -
 28
28 -
 29
29 -
 30
30 -
 31
31 -
 32
32 -
 33
33 -
 34
34 -
 35
35 -
 36
36 -
 37
37 -
 38
38 -
 39
39 -
 40
40 -
 41
41 -
 42
42 -
 43
43 -
 44
44 -
 45
45 -
 46
46 -
 47
47 -
48
-
49
-
50
-
51
-
52
-
53
-
54
-
55
-
56
-
57
-
58
-
59
-
60
-
61
-
62
-
63
-
64
-
65
-
66
-
67
-
68
-
69
-
70
-
71
-
72
-
73
-
74
-
75
-
76
-
77
-
78
-
79
-
80
-
81
-
82
-
83
-
84
-
85
-
86
-
87
-
88
-
89
-
90
-
91
-
92
-
93
-
94
-
95
-
96
-
97
-
98
-
99
-
100
-
101
-
102
-
103
-
104
-
105
-
106
-
107
-
108
-
109
-
110
-
111
-
112
-
113
-
114
-
115
-
116
-
117
-
118
-
119
-
120
-
121
-
122
-
123
-
124
-
125
-
126
-
127
-
128
-
129
-
130
-
131
-
132
-
133
-
134
-
135
-
136
-
137
-
138
-
139
-
140
-
141
-
142
-
143
-
144
-
145
-
146
-
147
-
148
-
149
-
150
-
151
-
152
-
153
-
154
-
155
-
156
 |
 |
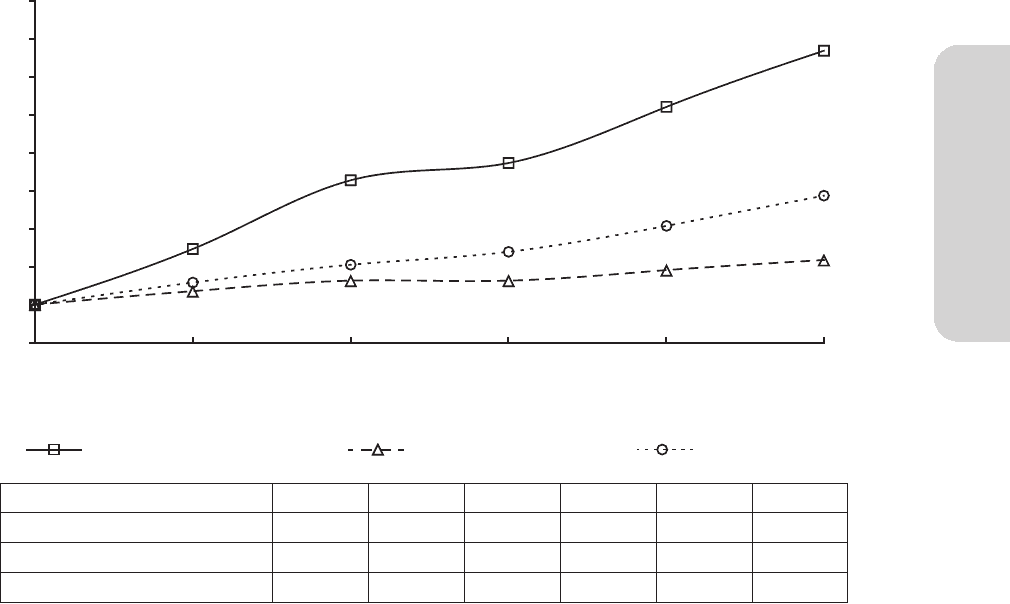
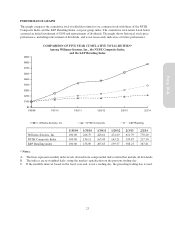
PERFORMANCE GRAPH
This graph compares the cumulative total stockholder return for our common stock with those of the NYSE
Composite Index and the S&P Retailing Index, our peer group index. The cumulative total return listed below
assumed an initial investment of $100 and reinvestment of dividends. The graph shows historical stock price
performance, including reinvestment of dividends, and is not necessarily indicative of future performance.
COMPARISON OF FIVE YEAR CUMULATIVE TOTAL RETURN*
Among Williams-Sonoma, Inc., the NYSE Composite Index,
and the S&P Retailing Index
$0
$100
$200
$300
$400
$800
$700
$600
$500
$900
1/30/09 1/31/10 1/30/11 1/29/12 2/2/142/3/13
Williams-Sonoma, Inc. NYSE Composite S&P Retailing
1/30/09 1/31/10 1/30/11 1/29/12 2/3/13 2/2/14
Williams-Sonoma, Inc. 100.00 246.79 428.61 474.49 621.79 770.40
NYSE Composite Index 100.00 136.11 163.09 163.21 190.87 217.50
S&P Retailing Index 100.00 158.09 205.65 239.57 308.25 387.81
* Notes:
A. The lines represent monthly index levels derived from compounded daily returns that include all dividends.
B. The indices are re-weighted daily, using the market capitalization on the previous trading day.
C. If the monthly interval, based on the fiscal year-end, is not a trading day, the preceding trading day is used.
23
Form 10-K