Pizza Hut 2006 Annual Report Download - page 76
Download and view the complete annual report
Please find page 76 of the 2006 Pizza Hut annual report below. You can navigate through the pages in the report by either clicking on the pages listed below, or by using the keyword search tool below to find specific information within the annual report.-
 1
1 -
2
-
3
-
4
-
5
-
6
-
7
-
8
-
9
-
10
-
11
-
12
-
13
-
14
-
15
-
16
-
17
-
18
-
19
-
20
-
21
-
22
-
23
-
24
-
25
-
26
-
27
-
28
-
29
-
30
-
31
-
32
-
33
-
34
-
35
-
36
-
37
-
38
-
39
-
40
-
41
-
42
-
43
-
44
-
45
-
46
-
47
-
48
-
49
-
50
-
51
-
52
-
53
-
54
-
55
-
56
-
57
-
58
-
59
-
60
-
61
-
62
-
63
-
64
-
65
-
 66
66 -
 67
67 -
 68
68 -
 69
69 -
 70
70 -
 71
71 -
 72
72 -
 73
73 -
 74
74 -
 75
75 -
 76
76 -
 77
77 -
 78
78 -
 79
79 -
 80
80 -
 81
81
 |
 |

81
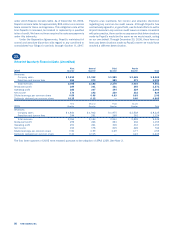
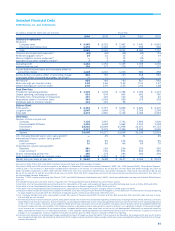
Selected Financial Data
YUM! Brands, Inc. and Subsidiaries
(in millions, except per share and unit amounts) Fiscal Year
2006 2005 2004 2003 2002
Summary of Operations
Revenues
Company sales $ 8,365 $ 8,225 $ 7,992 $ 7,441 $ 6,891
Franchise and license fees 1,196 1,124 1,019 939 866
Total 9,561 9,349 9,011 8,380 7,757
Closures and impairment expenses(a) (59) (62) (38) (40) (51)
Refranchising gain (loss)(a) 24 43 12 4 19
Wrench litigation income (expense)(b) — 2 14 (42) —
AmeriServe and other (charges) credits(c) 1 2 16 26 27
Operating profit 1,262 1,153 1,155 1,059 1,030
Interest expense, net 154 127 129 173 172
Income before income taxes and cumulative effect of
accounting change 1,108 1,026 1,026 886 858
Income before cumulative effect of accounting change 824 762 740 618 583
Cumulative effect of accounting change, net of tax(d) — — — (1) —
Net income 824 762 740 617 583
Basic earnings per common share 3.02 2.66 2.54 2.10 1.97
Diluted earnings per common share 2.92 2.55 2.42 2.02 1.88
Cash Flow Data
Provided by operating activities $ 1,302 $ 1,238 $ 1,186 $ 1,099 $ 1,112
Capital spending, excluding acquisitions 614 609 645 663 760
Proceeds from refranchising of restaurants 257 145 140 92 81
Repurchase shares of common stock 983 1,056 569 278 228
Dividends paid on common shares 144 123 58 — —
Balance Sheet
Total assets $ 6,353 $ 5,797 $ 5,696 $ 5,620 $ 5,400
Long-term debt 2,045 1,649 1,731 2,056 2,299
Total debt 2,272 1,860 1,742 2,066 2,445
Other Data
Number of stores at year end
Company 7,736 7,587 7,743 7,854 7,526
Unconsolidated Affiliates 1,206 1,648 1,662 1,512 2,148
Franchisees 23,516 22,666 21,858 21,471 20,724
Licensees 2,137 2,376 2,345 2,362 2,526
System 34,595 34,277 33,608 33,199 32,924
U.S. Company blended same store sales growth(e) — 4% 3% — 2%
International Division system sales growth(f)
Reported 7% 9% 14% 13% 6%
Local currency(g) 7% 6% 6% 5% 7%
China Division system sales growth(f)
Reported 26% 13% 23% 23% 25%
Local currency(g) 23% 11% 23% 23% 25%
Shares outstanding at year end 265 278 290 292 294
Cash dividends declared per common share $ 0.865 $ 0.445 $ 0.30 — —
Market price per share at year end $ 58.80 $ 46.88 $ 46.27 $ 33.64 $ 24.12
Fiscal years 2006, 2004, 2003 and 2002 include 52 weeks and fiscal year 2005 includes 53 weeks.
Fiscal years 2006 and 2005 include the impact of the adoption of Statement of Financial Accounting Standards (“SFAS”) No. 123R (Revised 2004), “Share Based Payment”
(“SFAS 123R”). This resulted in a $39 million and $38 million decrease in net income, or a decrease of $0.14 and $0.13 to both basic and diluted earnings per share for
2006 and 2005, respectively. If SFAS 123R had been effective for prior years presented, reported basic and diluted earnings per share would have decreased $0.12 and
$0.12, $0.12 and $0.12, and $0.14 and $0.13 per share for 2004, 2003 and 2002, respectively, consistent with previously disclosed pro-forma information. See Note 2 to
the Consolidated Financial Statements.
From May 7, 2002, results include Long John Silver’s (“LJS”) and A&W All-American Food Restaurants (“A&W”), which were added when we acquired Yorkshire Global Restau-
rants, Inc.
The selected financial data should be read in conjunction with the Consolidated Financial Statements and the Notes thereto.
(a) See Note 4 to the Consolidated Financial Statements for a description of Closures and Impairment Expenses and Refranchising Gain (Loss) in 2006, 2005 and 2004.
(b) See Note 4 to the Consolidated Financial Statements for a description of Wrench litigation in 2006, 2005 and 2004.
(c) See Note 4 to the Consolidated Financial Statements for a description of AmeriServe and other (charges) credits in 2006, 2005 and 2004.
(d) Fiscal year 2003 includes the impact of the adoption of SFAS No. 143, “Accounting for Asset Retirement Obligations,” which addresses the financial accounting and reporting
for legal obligations associated with the retirement of long-lived assets and the associated asset retirement costs.
(e) U.S. Company blended same-store sales growth includes the results of Company owned KFC, Pizza Hut and Taco Bell restaurants that have been open one year or more.
LJS and A&W are not included.
(f) International Division and China Division system sales growth includes the results of all restaurants regardless of ownership, including Company owned, franchise, unconsoli-
dated affiliate and license restaurants. Sales of franchise, unconsolidated affiliate and license restaurants generate franchise and license fees for the Company (typically at
a rate of 4% to 6% of sales). Franchise, unconsolidated affiliate and license restaurant sales are not included in Company sales we present on the Consolidated Statements
of Income; however, the fees are included in the Company’s revenues. We believe system sales growth is useful to investors as a significant indicator of the overall strength
of our business as it incorporates all our revenue drivers, Company and franchise same store sales as well as net unit development. Additionally, as previously noted, we
began reporting information for our international business in two separate operating segments (the International Division and the China Division) in 2005 as a result of
changes in our management structure. Segment information for periods prior to 2005 has been restated to reflect this reporting.
(g) Local currency represents the percentage change excluding the impact of foreign currency translation. These amounts are derived by translating current year results at prior
year average exchange rates. We believe the elimination of the foreign currency translation impact provides better year-to-year comparability without the distortion of foreign
currency fluctuations.