Pizza Hut 2006 Annual Report Download - page 2
Download and view the complete annual report
Please find page 2 of the 2006 Pizza Hut annual report below. You can navigate through the pages in the report by either clicking on the pages listed below, or by using the keyword search tool below to find specific information within the annual report.-
 1
1 -
 2
2 -
 3
3 -
 4
4 -
 5
5 -
 6
6 -
 7
7 -
 8
8 -
 9
9 -
 10
10 -
 11
11 -
 12
12 -
 13
13 -
14
-
15
-
16
-
17
-
18
-
19
-
20
-
21
-
22
-
23
-
24
-
25
-
26
-
27
-
28
-
29
-
30
-
31
-
32
-
33
-
34
-
35
-
36
-
37
-
38
-
39
-
40
-
41
-
42
-
43
-
44
-
45
-
46
-
47
-
48
-
49
-
50
-
51
-
52
-
53
-
54
-
55
-
56
-
57
-
58
-
59
-
60
-
61
-
62
-
63
-
64
-
65
-
66
-
67
-
68
-
69
-
70
-
71
-
72
-
73
-
74
-
75
-
76
-
77
-
78
-
79
-
80
-
81
 |
 |

TABLE OF CONTENTS
1–6 Dear Partners
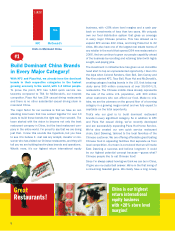
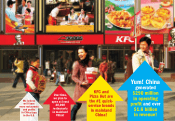
8 GoingforGreatnessinChina!
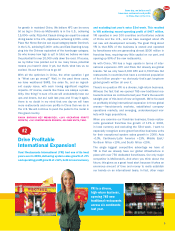
12 Going for Greatness Around the World!
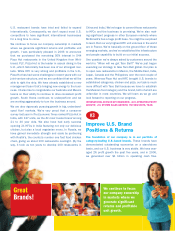
16 GreatRestaurantsStartwithGreatBrands!
20 KFC: Chicken Capital U.S.A.
22 TacoBell:ThinkOutsidetheBun
24 Pizza Hut: America’s Favorite Pizza
26 Long John Silver’s and A&W All American Food
27–29 A Great Culture Starts with Great People!: CHAMPS
30–32 Great Results!: Financial Review
33–84 Financials
INBC Doing Great Things for Our Community!
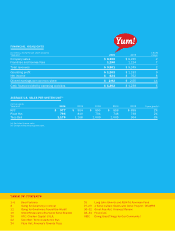
FINANCIAL HIGHLIGHTS
(In millions, except for per share amounts) % B/(W)
Year-end 2006 2005 change
Company sales $ 8,365 $ 8,225 2
Franchise and license fees 1,196 1,124 7
Total revenues $ 9,561 $ 9,349 2
Operating profit $ 1,262 $ 1,153 9
Net income $ 824 $ 762 8
Diluted earnings per common share $ 2.92 $ 2.55 14
Cash flows provided by operating activities $ 1,302 $ 1,238 5
AVERAGE U.S. SALES PER SYSTEM UNIT(a)
(In thousands)
Year- end 2006 2005 2004 2003 2002 5-year growth(b)
KFC $ 977 $ 954 $ 896 $ 898 $ 898 2%
Pizza Hut 794 810 794 748 748 2%
Taco Bell 1,176 1,168 1,069 1,005 964 6%
(a) Excludes license units.
(b)Compoundedannualgrowthrate.