Pizza Hut 2006 Annual Report Download - page 25
Download and view the complete annual report
Please find page 25 of the 2006 Pizza Hut annual report below. You can navigate through the pages in the report by either clicking on the pages listed below, or by using the keyword search tool below to find specific information within the annual report.-
 1
1 -
2
-
3
-
4
-
5
-
6
-
7
-
8
-
9
-
10
-
11
-
12
-
13
-
14
-
 15
15 -
 16
16 -
 17
17 -
 18
18 -
 19
19 -
 20
20 -
 21
21 -
 22
22 -
 23
23 -
 24
24 -
 25
25 -
 26
26 -
 27
27 -
 28
28 -
 29
29 -
 30
30 -
 31
31 -
 32
32 -
 33
33 -
 34
34 -
 35
35 -
36
-
37
-
38
-
39
-
40
-
41
-
42
-
43
-
44
-
45
-
46
-
47
-
48
-
49
-
50
-
51
-
52
-
53
-
54
-
55
-
56
-
57
-
58
-
59
-
60
-
61
-
62
-
63
-
64
-
65
-
66
-
67
-
68
-
69
-
70
-
71
-
72
-
73
-
74
-
75
-
76
-
77
-
78
-
79
-
80
-
81
 |
 |

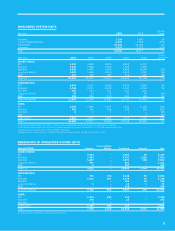
WORLDWIDE SALES
5-Year
(in billions) 2006 2005 2004 2003 2002 Growth(a)
UNITED STATES
KFC
Company sales $ 1.4 $ 1.4 $ 1.4 $ 1.4 $ 1.4 –
Franchisee sales (b) 3.9 3.8 3.6 3.5 3.4 4%
PH
Company sales $ 1.4 $ 1.6 $ 1.6 $ 1.6 $ 1.5 (1%)
Franchisee sales (b) 3.8 3.7 3.6 3.5 3.6 1%
TACO BELL
Company sales $ 1.8 $ 1.8 $ 1.7 $ 1.6 $ 1.6 5%
Franchisee sales (b) 4.5 4.4 4.0 3.8 3.6 5%
LONG JOHN SILVER’S (c)
Company sales $ 0.4 $ 0.5 $ 0.5 $ 0.5 $ 0.3 NM
Franchisee sales (b) 0.4 0.3 0.3 0.3 0.2 NM
A&W (c)
Company sales $– $– $– $ – $ – NM
Franchisee sales (b) 0.2 0.2 0.2 0.2 0.2 NM
TOTAL U.S.
Company sales $ 5.0 $ 5.3 $ 5.2 $ 5.1 $ 4.8 1%
Franchisee sales (b) 12.8 12.4 11.7 11.3 11.0 3%
INTERNATIONAL
KFC
Company sales $ 1.1 $ 1.1 $ 1.0 $ 0.9 $ 0.9 8%
Franchisee sales (b) 5.7 5.2 4.7 4.1 3.6 10%
PIZZA HUT
Company sales $ 0.7 $ 0.6 $ 0.7 $ 0.5 $ 0.5 7%
Franchisee sales (b) 3.1 3.0 2.6 2.4 2.2 9%
TACO BELL
Company sales $– $– $– $ – $ – NM
Franchisee sales (b) 0.2 0.2 0.2 0.1 0.2 16%
LONG JOHN SILVER’S (c)
Company sales –––––NM
Franchisee sales (b) –– – – – NM
A&W (c)
Company sales –– – – – NM
Franchisee sales (b) 0.1 0.1 0.1 0.1 – NM
TOTAL INTERNATIONAL
Company sales $ 1.8 $ 1.7 $ 1.7 $ 1.4 $ 1.4 7%
Franchisee sales (b) 9.1 8.5 7.6 6.7 6.0 10%
CHINA
KFC
Company sales $ 1.3 $ 1.0 $ 0.9 $ 0.8 $ 0.6 20%
Franchisee sales (b) 0.8 0.7 0.6 0.5 0.3 22%
PIZZA HUT
Company sales $ 0.3 $ 0.2 $ 0.2 $ 0.1 $ 0.1 NM
Franchisee sales (b) –– – – – NM
TOTAL CHINA
Company sales $ 1.6 $ 1.2 $ 1.1 $ 0.9 $ 0.7 23%
Franchisee sales (b) 0.8 0.7 0.6 0.5 0.3 21%
TOTAL WORLDWIDE
Company sales $ 8.4 $ 8.2 $ 8.0 $ 7.4 $ 6.9 5%
Franchisee sales (b) 22.7 21.6 19.9 18.5 17.3 6%
(a) Compounded annual growth rate; totals for U.S., International and Worldwide exclude the impact of Long John Silver’s and A&W.
(b) Franchisee sales represents the combined estimated sales of unconsolidated affiliate and franchise and license restaurants. Franchisee sales, which are not included in our Company
sales, generate franchise and license fees (typically at rates between 4% and 6%) that are included in our revenues.
(c) Beginning May 7, 2002, includes Long John Silver’s and A&W, which were added when we acquired Yorkshire Global Restaurants, Inc.
Consistency of Performance, Global Growth, and Cash Generation. In 2006, Yum! further built
upon its track record in these three important areas. In 2006, EPS grew 14%, the fifth straight year
we exceeded our target of double-digit growth. Our track record for global growth continued as we
opened nearly 1,200 new international restaurants, exceeding the 1,000 milestone for the sixth
consecutive year. Over the past three years, Yum! has added more restaurants outside the U.S. than
any other company — more than McDonald’s and more than Starbucks. In 2006, we also generated
a lot of cash. In fact, Yum! again generated over $1 billion that we returned to shareholders through
share buybacks and dividends. We will strive to make consistent financial performance, strong
global growth, and impressive cash generation key trademarks for Yum! while we “Go for Greatness
Around the Globe.” Rick Carucci, Chief Financial Officer, Yum! Brands, Inc.
great
results!
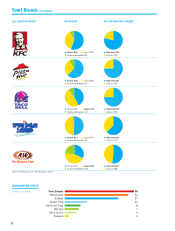
Global Facts