Pizza Hut 2006 Annual Report Download - page 28
Download and view the complete annual report
Please find page 28 of the 2006 Pizza Hut annual report below. You can navigate through the pages in the report by either clicking on the pages listed below, or by using the keyword search tool below to find specific information within the annual report.-
 1
1 -
2
-
3
-
4
-
5
-
6
-
7
-
8
-
9
-
10
-
11
-
12
-
13
-
14
-
15
-
16
-
17
-
 18
18 -
 19
19 -
 20
20 -
 21
21 -
 22
22 -
 23
23 -
 24
24 -
 25
25 -
 26
26 -
 27
27 -
 28
28 -
 29
29 -
 30
30 -
 31
31 -
 32
32 -
 33
33 -
 34
34 -
 35
35 -
 36
36 -
 37
37 -
 38
38 -
39
-
40
-
41
-
42
-
43
-
44
-
45
-
46
-
47
-
48
-
49
-
50
-
51
-
52
-
53
-
54
-
55
-
56
-
57
-
58
-
59
-
60
-
61
-
62
-
63
-
64
-
65
-
66
-
67
-
68
-
69
-
70
-
71
-
72
-
73
-
74
-
75
-
76
-
77
-
78
-
79
-
80
-
81
 |
 |

33
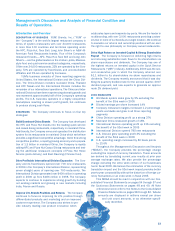
Introduction and Overview
DESCRIPTION OF BUSINESS YUM! Brands, Inc. (“YUM” or
the “Company”) is the world’s largest restaurant company in
terms of system restaurants with over 34,000 restaurants
in more than 100 countries and territories operating under
the KFC, Pizza Hut, Taco Bell, Long John Silver’s or A&W All-
American Food Restaurants brands. Four of the Company’s
restaurant brands — KFC, Pizza Hut, Taco Bell and Long John
Silver’s — are the global leaders in the chicken, pizza, Mexican-
style food and quick-service seafood categories, respectively.
Of the over 34,000 restaurants, 22% are operated by the Com-
pany, 72% are operated by franchisees and unconsolidated
affiliates and 6% are operated by licensees.
YUM’s business consists of three reporting segments:
United States, the International Division and the China Divi-
sion. The China Division includes mainland China, Thailand
and KFC Taiwan and the International Division includes the
remainder of our international operations. The China and Inter-
national Divisions have been experiencing dramatic growth and
now represent approximately half of the Company’s operating
profits. The U.S. business operates in a highly competitive
marketplace resulting in slower profit growth, but continues
to produce strong cash flows.
STRATEGIES The Company continues to focus on four key
strategies:
Build Dominant China Brands The Company has developed
the KFC and Pizza Hut brands into the leading quick service
and casual dining restaurants, respectively, in mainland China.
Additionally, the Company owns and operates the distribution
system for its restaurants in mainland China which we believe
provides a significant competitive advantage. Given this strong
competitive position, a rapidly growing economy and a popula-
tion of 1.3 billion in mainland China, the Company is rapidly
adding KFC and Pizza Hut Casual Dining restaurants and test-
ing the additional restaurant concepts of Pizza Hut Home
Service (pizza delivery) and East Dawning (Chinese food).
Drive Profitable International Division Expansion The Com-
pany and its franchisees opened over 700 new restaurants
in 2006 in the Company’s International Division, representing
seven straight years of opening over 700 restaurants. The
International Division generated over $400 million in operating
profit in 2006 up from $186 million in 1998. The Company
expects to continue to experience strong growth by building
out existing markets and growing in new markets including
India, France and Russia.
Improve U.S. Brands Positions and Returns The Company
continues to focus on improving its U.S. position through
differentiated products and marketing and an improved
customer experience. The Company also strives to pro-
vide industry leading new product innovation which
adds sales layers and expands day parts. We are the leader in
multibranding, with over 3,000 restaurants providing custom-
ers two or more of our brands at a single location. We continue
to evaluate our returns and ownership positions with an earn
the right to own philosophy on Company owned restaurants.
Drive High Return on Invested Capital & Strong Shareholder
Payout The Company is focused on delivering high returns
and returning substantial cash flows to its shareholders via
share repurchases and dividends. The Company has one of
the highest returns on invested capital in the Quick Service
Restaurants (“QSR”) industry. Additionally, 2006 was the sec-
ond consecutive year in which the Company returned over
$1.1 billion to its shareholders via share repurchases and
dividends. The Company recently announced that it was dou-
bling its quarterly dividend rate for the second quarter, 2007
dividend payment, and now expects to generate an approxi-
mate 2% dividend yield.
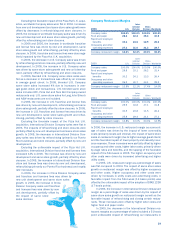
2006 HIGHLIGHTS
Worldwide system sales grew by 5% excluding the
benefit of the 53rd week in 2005
Diluted earnings per share increased 14%
Company restaurant margins increased 1.2 percentage
points worldwide and grew in all three reporting
segments
China Division operating profit up a strong 37%
Mainland China restaurant growth of 18%
International Division operating profit up 11% excluding
the benefit of the 53rd week in 2005
International Division opened 785 new restaurants
U.S. Division grew operating profit 3% excluding the
benefit of the 53rd week in 2005
U.S. operating margin increased by 80 basis points
to 13.6%
Throughout the Management’s Discussion and Analysis
(“MD&A”), the Company provides the percentage change
excluding the impact of currency translation. These amounts
are derived by translating current year results at prior year
average exchange rates. We also provide the percentage
change excluding the extra week certain of our businesses
had in fiscal 2005. We believe the elimination of the currency
translation impact and the 53rd week impact provides better
year-to-year comparability without the distortion of foreign cur-
rency fluctuations or an extra week in fiscal 2005.
This MD&A should be read in conjunction with our Con-
solidated Financial Statements on pages 54 through 57 and
the Cautionary Statements on pages 48 and 49. All Note
references herein refer to the Notes to the Consolidated
Financial Statements on pages 58 through 80. Tabular
amounts are displayed in millions except per share
and unit count amounts, or as otherwise specifi-
cally identified.
Management’s Discussion and Analysis of Financial Condition and
Results of Operations.