Pizza Hut 2006 Annual Report Download - page 35
Download and view the complete annual report
Please find page 35 of the 2006 Pizza Hut annual report below. You can navigate through the pages in the report by either clicking on the pages listed below, or by using the keyword search tool below to find specific information within the annual report.-
 1
1 -
2
-
3
-
4
-
5
-
6
-
7
-
8
-
9
-
10
-
11
-
12
-
13
-
14
-
15
-
16
-
17
-
18
-
19
-
20
-
21
-
22
-
23
-
24
-
 25
25 -
 26
26 -
 27
27 -
 28
28 -
 29
29 -
 30
30 -
 31
31 -
 32
32 -
 33
33 -
 34
34 -
 35
35 -
 36
36 -
 37
37 -
 38
38 -
 39
39 -
 40
40 -
 41
41 -
 42
42 -
 43
43 -
 44
44 -
 45
45 -
46
-
47
-
48
-
49
-
50
-
51
-
52
-
53
-
54
-
55
-
56
-
57
-
58
-
59
-
60
-
61
-
62
-
63
-
64
-
65
-
66
-
67
-
68
-
69
-
70
-
71
-
72
-
73
-
74
-
75
-
76
-
77
-
78
-
79
-
80
-
81
 |
 |

40 YUM! BRANDS, INC.
Puerto Rico. Also contributing to the decrease were higher
occupancy and other costs and higher labor costs. The
decrease was partially offset by the impact of same store
sales growth on restaurant margin. The unfavorable impact of
the adoption of SFAS 123R (10 basis points) was largely offset
by the favorable impact of the 53rd week (8 basis points).
In 2006, the increase in China Division restaurant margin
as a percentage of sales was driven by the impact of same
store sales growth on restaurant margin. The increase was
partially offset by the impact of lower margins associated with
new units during the initial periods of operations.
In 2005, China Division restaurant margins as a per-
centage of sales decreased. The decrease was driven by the
impact on restaurant margin of same store sales declines
and lower margins associated with new units during the initial
periods of operation. Also contributing to the decrease was
higher labor costs. The decrease was partially offset by lower
food and paper costs (principally due to supply chain savings
initiatives).
Worldwide General and Administrative Expenses
General and administrative (“G&A”) expenses increased
$29 million or 2% in 2006, including a 1% favorable impact
from lapping the 53rd week in 2005. The increase was pri-
marily driven by higher compensation related costs, including
amounts associated with investments in strategic initiatives
in China and other international growth markets, as well as
G&A expenses for our Pizza Hut U.K. business which were
previously netted within equity income prior to our acquisition
of the remaining fifty percent interest of the business in 2006.
These increases were partially offset by lapping higher prior
year litigation related costs.
G&A expenses increased $102 million or 10% in 2005,
including a 4% unfavorable impact of the adoption of SFAS
123R, a 1% unfavorable impact from the 53rd week and a
1% unfavorable impact from foreign currency translation.
Excluding the unfavorable impact of these factors, general
and administrative expenses increased $38 million or 4%.
The increase was driven by higher compensation related
costs, including amounts associated with investments in
strategic initiatives in China and other international growth
markets, and higher litigation related costs including charges
of $16 million for the potential resolution of certain legal mat-
ters. Higher charitable contributions and expense associated
with discontinuing certain corporate software development
projects also contributed to the increase. Such increases
were partially offset by reductions associated with operating
restaurants which were refranchised in 2004 (primarily the
Puerto Rico business) and the effect of lapping certain prior
year reserve increases related to potential development sites
and surplus facilities.
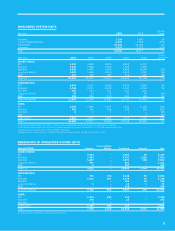
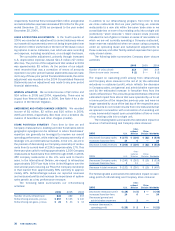
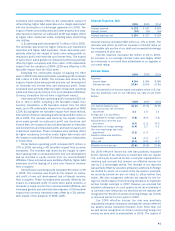
Worldwide Other (Income) Expense
2006 2005 2004
Equity income from investments in
unconsolidated affiliates $ (51) $ (51) $ (54)
Gain upon sale of investment in
unconsolidated affiliate(a) (2) (11) —
Recovery from supplier(b) — (20) —
Foreign exchange net (gain) loss
and other (6) 2 (1)
Contract termination charge(c) 8 — —
Other (income) expense $ (51) $ (80) $ (55)
(a) Reflects gains related to the 2005 sale of our fifty percent interest in the entity
that operated almost all KFCs and Pizza Huts in Poland and the Czech Republic
to our then partner in the entity.
(b) Relates to a financial recovery from a supplier ingredient issue in mainland China
totaling $24 million, $4 million of which was recognized through equity income
from investments in unconsolidated affiliates.
(c) Reflects an $8 million charge associated with the termination of a beverage agree-
ment in the United States segment.
Worldwide Closure and Impairment Expenses and
Refranchising (Gain) Loss
See the Store Portfolio Strategy section for more detail of our
refranchising and closure activities and Note 4 for a summary
of the components of facility actions by reportable operating
segment.
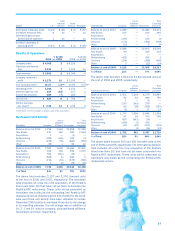
Operating Profit
% Increase/
(Decrease)
2006 2005 2006 2005
United States $ 763 $ 760 — (2)
International Division 407 372 9 11
China Division 290 211 37 3
Unallocated and corporate
expenses (229) (246) (7) 21
Unallocated other income
(expense) 6 9 NM NM
Unallocated refranchising
gain (loss) 24 43 NM NM
Wrench litigation income
(expense) — 2 NM NM
AmeriServe and other
(charges) credits 1 2 NM NM
Operating profit $ 1,262 $ 1,153 9 —
United States operating
margin 13.6% 12.8% 0.8ppts. (0.7)ppts.
International Division
operating margin 17.6% 17.5% 0.1ppts. 1.7ppts.
Neither unallocated and corporate expenses, which comprise
G&A expenses, nor unallocated refranchising gain (loss) are
allocated to the U.S., International Division, or China Division
segments for performance reporting purposes. The decrease
in corporate and unallocated expenses in 2006 was driven
by the lapping of the unfavorable impact of 2005 litigation
related costs.
Excluding the unfavorable impact of lapping the 53rd
week in 2005, U.S. operating profit increased $23 million
or 3% in 2006. The increase was driven by the impact of
same store sales on restaurant profit (due to higher average
guest check) and franchise and license fees, new unit devel-
opment and lower closures and impairment expenses. These