Pizza Hut 2006 Annual Report Download - page 36
Download and view the complete annual report
Please find page 36 of the 2006 Pizza Hut annual report below. You can navigate through the pages in the report by either clicking on the pages listed below, or by using the keyword search tool below to find specific information within the annual report.-
 1
1 -
2
-
3
-
4
-
5
-
6
-
7
-
8
-
9
-
10
-
11
-
12
-
13
-
14
-
15
-
16
-
17
-
18
-
19
-
20
-
21
-
22
-
23
-
24
-
25
-
 26
26 -
 27
27 -
 28
28 -
 29
29 -
 30
30 -
 31
31 -
 32
32 -
 33
33 -
 34
34 -
 35
35 -
 36
36 -
 37
37 -
 38
38 -
 39
39 -
 40
40 -
 41
41 -
 42
42 -
 43
43 -
 44
44 -
 45
45 -
 46
46 -
47
-
48
-
49
-
50
-
51
-
52
-
53
-
54
-
55
-
56
-
57
-
58
-
59
-
60
-
61
-
62
-
63
-
64
-
65
-
66
-
67
-
68
-
69
-
70
-
71
-
72
-
73
-
74
-
75
-
76
-
77
-
78
-
79
-
80
-
81
 |
 |

41
increases were partially offset by the unfavorable impact of
refranchising, higher G&A expenses and a charge associated
with the termination of a beverage agreement in 2006. The
impact of lower commodity costs and lower property and casu-
alty insurance expense on restaurant profit was largely offset
by higher other restaurant costs, including labor, advertising
and utilities.
U.S. operating profit decreased $17 million or 2% in 2005.
The decrease was driven by higher closures and impairment
expenses and higher G&A expenses. These decreases were
partially offset by the impact of same store sales growth on
restaurant profit and franchise and license fees. The impact
of same store sales growth on restaurant profit was partially
offset by higher occupancy and other costs. A 3% unfavorable
impact from the adoption of SFAS 123R was offset by a 3%
favorable impact from the 53rd week.
Excluding the unfavorable impact of lapping the 53rd
week in 2005, International Division operating profit increased
$41 million or 11% in 2006. The increase was driven by the
impact of same store sales growth and new unit development
on franchise and license fees and restaurant profit. These
increases were partially offset by higher restaurant operating
costs and lower equity income from unconsolidated affiliates.
Currency translation did not have a significant impact.
International Division operating profit increased $35 mil-
lion or 11% in 2005, including a 4% favorable impact from
currency translation, a 2% favorable impact from the 53rd
week, and a 4% unfavorable impact from the adoption of SFAS
123R. Excluding the net favorable impact from these factors,
International Division operating profit increased $31 million or
9% in 2005. The increase was driven by the impact of same
store sales growth on restaurant profit and franchise and
license fees, the impact of new unit development on franchise
and license fees and restaurant profit, and lower closures and
impairment expenses. These increases were partially offset
by higher occupancy and other costs, higher labor costs and
the impact on operating profit of refranchising our restaurants
in Puerto Rico.
China Division operating profit increased $79 million or
37% in 2006 including a 4% favorable impact from currency
translation. The increase was driven by the impact of same
store sales growth on restaurant profit, new unit development
and an increase in equity income from our unconsolidated
affiliates. These increases were partially offset by higher G&A
expenses and the lapping of a prior year financial recovery
from a supplier.
China Division operating profit increased $6 million or 3%
in 2005. The increase was driven by the impact on restau-
rant profit of new unit development and a financial recovery
from a supplier. These increases were partially offset by the
impact on restaurant profit of same store sales declines, a
decrease in equity income from unconsolidated affiliates, and
increased general and administrative expense. A 2% favorable
impact from currency translation was offset by a 2% unfavor-
able impact of the adoption of SFAS 123R.
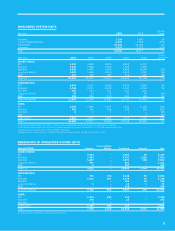
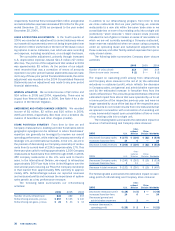
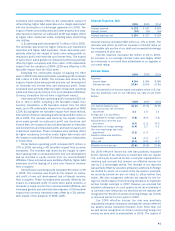
Interest Expense, Net
2006 2005 2004
Interest expense $ 172 $ 147 $ 145
Interest income (18) (20) (16)
Interest expense, net $ 154 $ 127 $ 129
Interest expense increased $25 million or 17% in 2006. The
increase was driven by both an increase in interest rates on
the variable rate portion of our debt and increased borrowings
as compared to prior year.
Interest expense increased $2 million or 2% in 2005.
An increase in our average interest rates was largely offset
by a decrease in our bank fees attributable to an upgrade in
our credit rating.
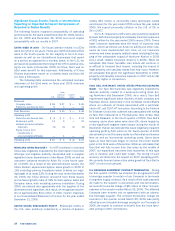
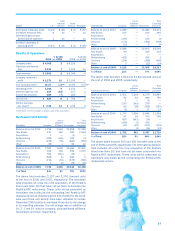
Income Taxes
2006 2005 2004
Reported
Income taxes $ 284 $ 264 $ 286
Effective tax rate 25.6% 25.8% 27.9%
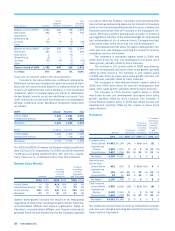
The reconciliation of income taxes calculated at the U.S. fed-
eral tax statutory rate to our effective tax rate is set forth
below:
2006 2005 2004
U.S. federal statutory rate 35.0% 35.0% 35.0%
State income tax, net of federal
tax benefit 2.0 1.6 1.3
Foreign and U.S. tax effects
attributable to foreign operations (7.8) (8.4) (7.8)
Adjustments to reserves and
prior years (3.5) (1.1) (6.7)
Repatriation of foreign earnings (0.4) 2.0 0.5
Non-recurring foreign tax credit
adjustment (6.2) (1.7) —
Valuation allowance additions
(reversals) 6.8 (1.1) 5.7
Other, net (0.3) (0.5) (0.1)
Effective income tax rate 25.6% 25.8% 27.9%
Our 2006 effective income tax rate was positively impacted
by the reversal of tax reserves in connection with our regular
U.S. audit cycle as well as certain out-of-year adjustments to
reserves and accruals that lowered our effective income tax
rate by 2.2 percentage points. The reversal of tax reserves
was partially offset by valuation allowance additions on foreign
tax credits for which, as a result of the tax reserve reversals,
we currently believe we are not likely to utilize before they
expire. We also recognized deferred tax assets for the for-
eign tax credit impact of non-recurring decisions to repatriate
certain foreign earnings in 2007. However, we provided full
valuation allowances on such assets as we do not believe it
is currently more likely than not that they will be realized. We
recognized the benefit of certain recurring foreign tax credits
in amounts similar to prior years in 2006.
Our 2005 effective income tax rate was positively
impacted by valuation allowance reversals for certain deferred
tax assets whose realization became more likely than not
as well as the recognition of certain nonrecurring foreign tax
credits we were able to substantiate in 2005. The impact of