Pizza Hut 2006 Annual Report Download - page 49
Download and view the complete annual report
Please find page 49 of the 2006 Pizza Hut annual report below. You can navigate through the pages in the report by either clicking on the pages listed below, or by using the keyword search tool below to find specific information within the annual report.-
 1
1 -
2
-
3
-
4
-
5
-
6
-
7
-
8
-
9
-
10
-
11
-
12
-
13
-
14
-
15
-
16
-
17
-
18
-
19
-
20
-
21
-
22
-
23
-
24
-
25
-
26
-
27
-
28
-
29
-
30
-
31
-
32
-
33
-
34
-
35
-
36
-
37
-
38
-
 39
39 -
 40
40 -
 41
41 -
 42
42 -
 43
43 -
 44
44 -
 45
45 -
 46
46 -
 47
47 -
 48
48 -
 49
49 -
 50
50 -
 51
51 -
 52
52 -
 53
53 -
 54
54 -
 55
55 -
 56
56 -
 57
57 -
 58
58 -
 59
59 -
60
-
61
-
62
-
63
-
64
-
65
-
66
-
67
-
68
-
69
-
70
-
71
-
72
-
73
-
74
-
75
-
76
-
77
-
78
-
79
-
80
-
81
 |
 |

54 YUM! BRANDS, INC.
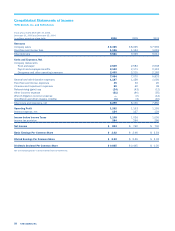
Consolidated Statements of Income
YUM! Brands, Inc. and Subsidiaries
Fiscal years ended December 30, 2006,
December 31, 2005 and December 25, 2004
(in millions, except per share data) 2006 2005 2004
Revenues
Company sales $ 8,365 $ 8,225 $ 7,992
Franchise and license fees 1,196 1,124 1,019
Total revenues 9,561 9,349 9,011
Costs and Expenses, Net
Company restaurants
Food and paper 2,549 2,584 2,538
Payroll and employee benefits 2,142 2,171 2,112
Occupancy and other operating expenses 2,403 2,315 2,183
7,094 7,070 6,833
General and administrative expenses 1,187 1,158 1,056
Franchise and license expenses 35 33 26
Closures and impairment expenses 59 62 38
Refranchising (gain) loss (24) (43) (12)
Other (income) expense (51) (80) (55)
Wrench litigation (income) expense —(2) (14)
AmeriServe and other charges (credits) (1) (2) (16)
Total costs and expenses, net 8,299 8,196 7,856
Operating Profit 1,262 1,153 1,155
Interest expense, net 154 127 129
Income before Income Taxes 1,108 1,026 1,026
Income tax provision 284 264 286
Net Income $ 824 $ 762 $ 740
Basic Earnings Per Common Share $ 3.02 $ 2.66 $ 2.54
Diluted Earnings Per Common Share $ 2.92 $ 2.55 $ 2.42
Dividends Declared Per Common Share $ 0.865 $ 0.445 $ 0.30
See accompanying Notes to Consolidated Financial Statements.