Pizza Hut 2006 Annual Report Download - page 26
Download and view the complete annual report
Please find page 26 of the 2006 Pizza Hut annual report below. You can navigate through the pages in the report by either clicking on the pages listed below, or by using the keyword search tool below to find specific information within the annual report.
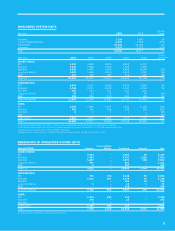
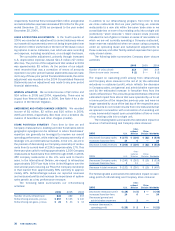
WORLDWIDE SYSTEM UNITS
% B/(W)
Year-end 2006 2005 Change
Company 7,736 7,587 2%
Unconsolidated affiliates 1,206 1,648 (27%)
Franchisees 23,516 22,666 4%
Licensees 2,137 2,376 (10%)
Total 34,595 34,277 1%
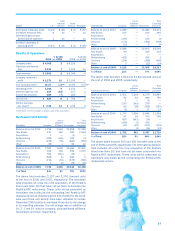
5-Year
Year-end 2006 2005 2004 2003 2002 Growth(a) (b)
UNITED STATES
KFC 5,394 5,443 5,525 5,524 5,472 –
Pizza Hut 7,532 7,566 7,500 7,523 7,599 –
Taco Bell 5,608 5,845 5,900 5,989 6,165 (3%)
Long John Silver’s 1,121 1,169 1,200 1,204 1,221 NM
A&W 406 449 485 576 665 NM
Total U.S. (c) 20,061 20,472 20,610 20,822 21,126 (1%)
INTERNATIONAL
KFC 6,606 6,307 6,084 5,944 5,698 4%
Pizza Hut 4,788 4,701 4,528 4,357 4,249 3%
Taco Bell 236 243 237 247 261 –
Long John Silver’s 35 34 34 31 28 NM
A&W 238 229 210 183 182 NM
Total International 11,903 11,514 11,093 10,762 10,418 3%
CHINA
KFC 2,258 1,981 1,657 1,410 1,192 19%
Pizza Hut 365 305 246 204 182 20%
Taco Bell 2 2 1 1 – NM
A&W – – – – 6 NM
Total China (d) 2,631 2,291 1,905 1,615 1,380 19%
Total (c)(d) 34,595 34,277 33,608 33,199 32,924 1%
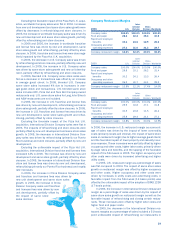
(a) Compounded annual growth rate; total U.S., International and Worldwide excludes the impact of Long John Silver’s and A&W.
(b) Compounded annual growth rate excludes the impact of transferring 30 units from Taco Bell U.S. to Taco Bell International in 2002.
(c) Includes 6 and 4 Yan Can units in 2003 and 2002, respectively.
(d) Includes 6 units, 3 units and 1 unit in 2006, 2005 and 2004, respectively, for an Asian food concept in China.
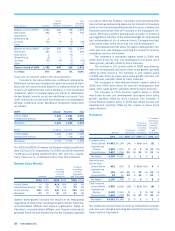
BREAKDOWN OF WORLDWIDE SYSTEM UNITS
Unconsolidated
Year-end 2006 Company Affiliate Franchised Licensed Total
UNITED STATES
KFC 1,023 – 4,287 84 5,394
Pizza Hut 1,453 – 4,757 1,322 7,532
Taco Bell 1,267 – 3,803 538 5,608
Long John Silver’s 460 – 661 – 1,121
A&W 9 – 397 – 406
Total U.S. 4,212 – 13,905 1,944 20,061
INTERNATIONAL
KFC 750 354 5,446 56 6,606
Pizza Hut 1,011 207 3,476 94 4,788
Taco Bell – – 194 42 236
Long John Silver’s 1 – 33 1 35
A&W – – 238 – 238
Total International 1,762 561 9,387 193 11,903
CHINA
KFC 1,414 645 199 – 2,258
Pizza Hut 340 – 25 – 365
Taco Bell 2 – – – 2
Total China (a) 1,762 645 224 – 2,631
Total (a) 7,736 1,206 23,516 2,137 34,595
(a) Includes 6 units in 2006 for an Asian food concept in China.
31


