Pizza Hut 2006 Annual Report Download - page 71
Download and view the complete annual report
Please find page 71 of the 2006 Pizza Hut annual report below. You can navigate through the pages in the report by either clicking on the pages listed below, or by using the keyword search tool below to find specific information within the annual report.-
 1
1 -
2
-
3
-
4
-
5
-
6
-
7
-
8
-
9
-
10
-
11
-
12
-
13
-
14
-
15
-
16
-
17
-
18
-
19
-
20
-
21
-
22
-
23
-
24
-
25
-
26
-
27
-
28
-
29
-
30
-
31
-
32
-
33
-
34
-
35
-
36
-
37
-
38
-
39
-
40
-
41
-
42
-
43
-
44
-
45
-
46
-
47
-
48
-
49
-
50
-
51
-
52
-
53
-
54
-
55
-
56
-
57
-
58
-
59
-
60
-
 61
61 -
 62
62 -
 63
63 -
 64
64 -
 65
65 -
 66
66 -
 67
67 -
 68
68 -
 69
69 -
 70
70 -
 71
71 -
 72
72 -
 73
73 -
 74
74 -
 75
75 -
 76
76 -
 77
77 -
 78
78 -
 79
79 -
 80
80 -
 81
81
 |
 |

76 YUM! BRANDS, INC.
At December 30, 2006, we had investments in 6 unconsolidated
affiliates outside the U.S. which operate principally KFC and/or
Pizza Hut restaurants. These unconsolidated affiliates operate
in China and Japan.
We identify our operating segments based on management
responsibility. As noted in Note 1, in 2005 we began reporting
information for our international business in two separate operat-
ing segments as a result of changes in our management reporting
structure. The China Division includes mainland China, Thailand,
KFC Taiwan, and the International Division includes the remainder
of our international operations. Segment information for previous
periods has been restated to reflect this reporting. For purposes
of applying SFAS No. 131, “Disclosure About Segments of An
Enterprise and Related Information” (“SFAS 131”) in the U.S.,
we consider LJS and A&W to be a single operating segment. We
consider our KFC, Pizza Hut, Taco Bell and LJS/A&W operating
segments in the U.S. to be similar and therefore have aggregated
them into a single reportable operating segment.
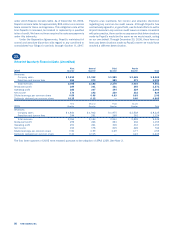
Revenues
2006 2005 2004
United States $ 5,603 $ 5,929 $ 5,763
International Division(a) 2,320 2,124 2,128
China Division(a) 1,638 1,296 1,120
$ 9,561 $ 9,349 $ 9,011
Operating Profit;
Interest Expense, Net; and
Income Before Income Taxes
2006 2005 2004
United States $ 763 $ 760 $ 777
International Division(b) 407 372 337
China Division(b) 290 211 205
Unallocated and corporate expenses (229) (246) (204)
Unallocated other income (expense)(c) 6 9 (2)
Unallocated refranchising gain (loss)(d) 24 43 12
Wrench litigation income (expense)(e) — 2 14
AmeriServe and other (charges)
credits(e) 1 2 16
Total operating profit 1,262 1,153 1,155
Interest expense, net (154) (127) (129)
Income before income taxes $ 1,108 $ 1,026 $ 1,026
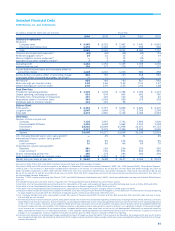
Depreciation and Amortization
2006 2005 2004
United States $ 259 $ 266 $ 267
International Division 115 107 99
China Division 95 82 69
Corporate 10 14 13
$ 479 $ 469 $ 448
Capital Spending
2006 2005 2004
United States $ 329 $ 333 $ 365
International Division 118 96 121
China Division 165 159 118
Corporate 2 21 41
$ 614 $ 609 $ 645
Identifiable Assets
2006 2005 2004
United States $ 2,909 $ 3,118 $ 3,316
International Division(f) 2,100 1,536 1,441
China Division(f) 869 746 613
Corporate(g) 475 397 326
$ 6,353 $ 5,797 $ 5,696
Long-Lived Assets(h)
2006 2005 2004
United States $ 2,604 $ 2,800 $ 2,900
International Division(i) 1,357 804 904
China Division(i) 595 517 436
Corporate 84 103 99
$ 4,640 $ 4,224 $ 4,339
(a) Includes revenues of $673 million, $483 million and $467 million for entities in
the United Kingdom for 2006, 2005 and 2004, respectively. Includes revenues of
$1.4 billion, $1.0 billion and $903 million in mainland China for 2006, 2005 and
2004, respectively.
(b) Includes equity income of unconsolidated affiliates of $10 million, $21 million and
$25 million in 2006, 2005 and 2004, respectively, for the International Division.
Includes equity income of unconsolidated affiliates of $41 million, $30 million,
and $32 million in 2006, 2005 and 2004, respectively, for the China Division.
(c) Includes net gains of approximately $2 million and $11 million in 2006 and 2005,
respectively, associated with the sale of our Poland/Czech Republic business. See
Note 8.
(d) Refranchising gain (loss) is not allocated to the U.S., International Division or China
Division segments for performance reporting purposes.
(e) See Note 4 for a discussion of AmeriServe and other (charges) credits and Note 4
for a discussion of Wrench litigation.
(f) Includes investment in unconsolidated affiliates of $64 million, $117 million and
$143 million for 2006, 2005 and 2004, respectively, for the International Division.
Includes investment in unconsolidated affiliates of $74 million, $56 million and
$51 million for 2006, 2005 and 2004, respectively, for the China Division.
(g) Primarily includes deferred tax assets, property, plant and equipment, net, related
to our office facilities and cash.
(h) Includes property, plant and equipment, net, goodwill, and intangible assets, net.
(i) Includes long-lived assets of $813 million, $271 million and $295 million for
entities in the United Kingdom for 2006, 2005 and 2004, respectively. Includes
long-lived assets of $495 million, $430 million and $342 million in mainland China
for 2006, 2005 and 2004, respectively.
See Note 4 for additional operating segment disclosures related
to impairment, store closure costs (income) and the carrying
amount of assets held for sale.
22.
Guarantees, Commitments and Contingencies
LEASE GUARANTEES AND CONTINGENCIES As a result of (a)
assigning our interest in obligations under real estate leases as a
condition to the refranchising of certain Company restaurants; (b)
contributing certain Company restaurants to unconsolidated affili-
ates; and (c) guaranteeing certain other leases, we are frequently
contingently liable on lease agreements. These leases have vary-
ing terms, the latest of which expires in 2026. As of December
30, 2006 and December 31, 2005, the potential amount of
undiscounted payments we could be required to make in the
event of non-payment by the primary lessee was $418 million and
$374 million, respectively. The present value of these potential
payments discounted at our pre-tax cost of debt at December
30, 2006 was $336 million. Our franchisees are the primary
lessees under the vast majority of these leases. We generally
have cross-default provisions with these franchisees that would
put them in default of their franchise agreement in the event of
non-payment under the lease. We believe these cross-default
provisions significantly reduce the risk that we will be required
to make payments under these leases. Accordingly, the liability