Pizza Hut 2006 Annual Report Download - page 27
Download and view the complete annual report
Please find page 27 of the 2006 Pizza Hut annual report below. You can navigate through the pages in the report by either clicking on the pages listed below, or by using the keyword search tool below to find specific information within the annual report.-
 1
1 -
2
-
3
-
4
-
5
-
6
-
7
-
8
-
9
-
10
-
11
-
12
-
13
-
14
-
15
-
16
-
 17
17 -
 18
18 -
 19
19 -
 20
20 -
 21
21 -
 22
22 -
 23
23 -
 24
24 -
 25
25 -
 26
26 -
 27
27 -
 28
28 -
 29
29 -
 30
30 -
 31
31 -
 32
32 -
 33
33 -
 34
34 -
 35
35 -
 36
36 -
 37
37 -
38
-
39
-
40
-
41
-
42
-
43
-
44
-
45
-
46
-
47
-
48
-
49
-
50
-
51
-
52
-
53
-
54
-
55
-
56
-
57
-
58
-
59
-
60
-
61
-
62
-
63
-
64
-
65
-
66
-
67
-
68
-
69
-
70
-
71
-
72
-
73
-
74
-
75
-
76
-
77
-
78
-
79
-
80
-
81
 |
 |
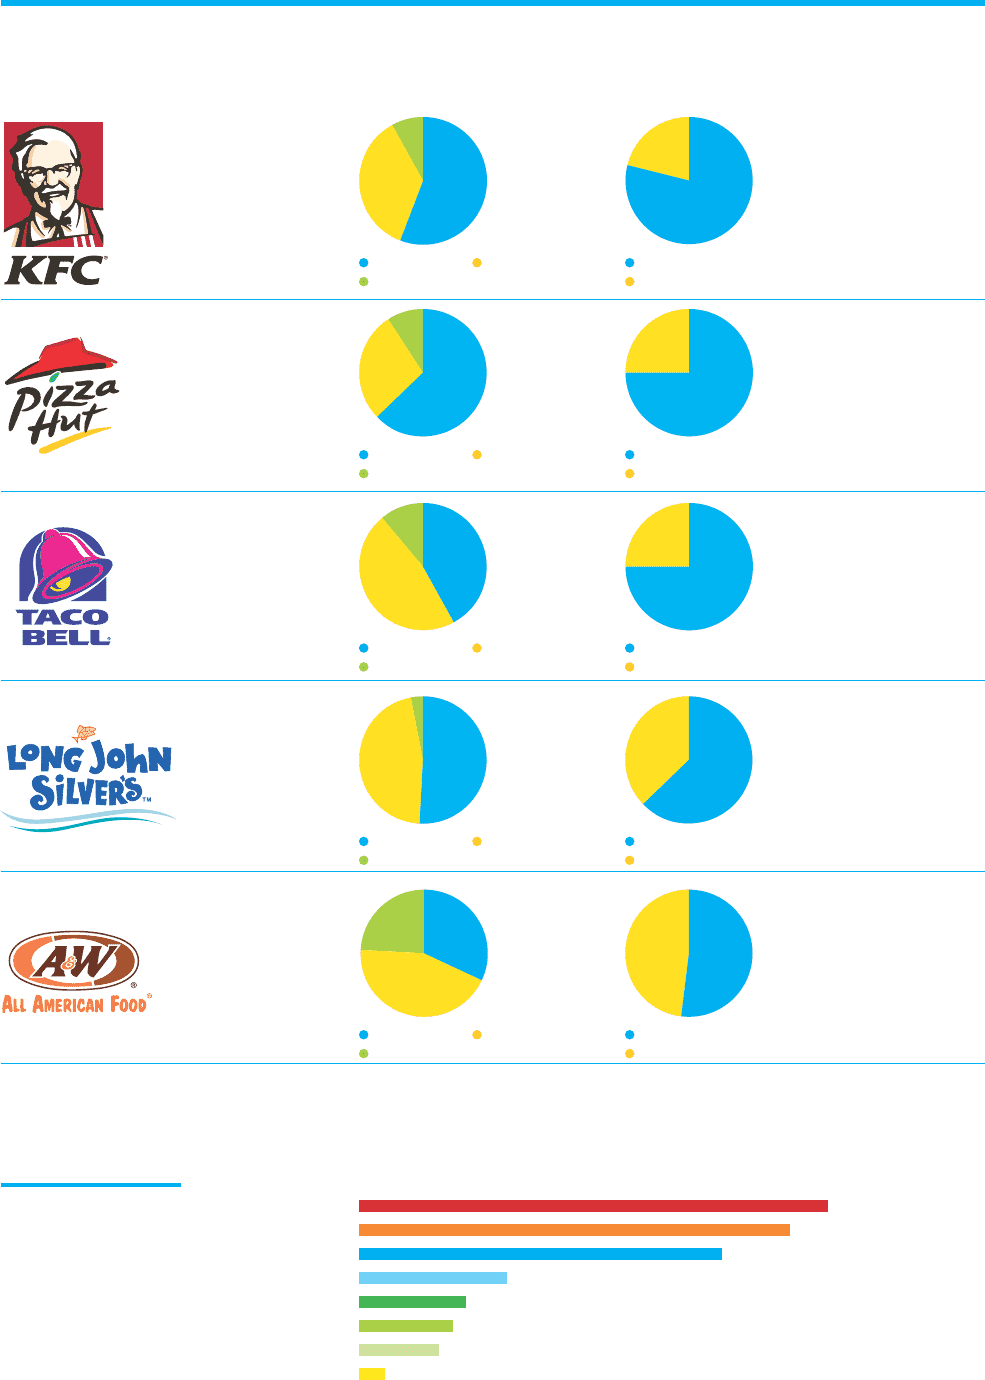
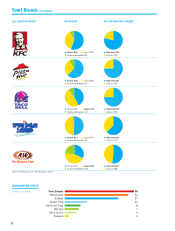
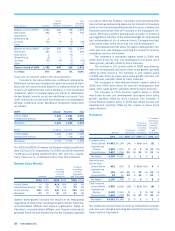
Dinner 56% Lunch 36%
Snacks/Breakfast 8%
Dine Out 79%
Dine In 21%
Dinner 63% Lunch 28%
Snacks/Breakfast 9%
Dine Out 75%
Dine In 25%
Dinner 42% Lunch 47%
Snacks/Breakfast 11%
Dine Out 75%
Dine In 25%
Dinner 51% Lunch 46%
Snacks/Breakfast 3%
Dine Out 63%
Dine In 37%
Dinner 32% Lunch 44%
Snacks/Breakfast 24%
Dine Out 52%
Dine In 48%
U.S. SALES BY BRAND BY DAYPART BY DISTRIBUTION CHANNEL
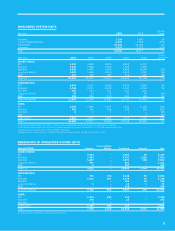
WORLDWIDE UNITS
2006 (in thousands)
Yum! Brands at-a-glance
Yum! Brands
McDonald’s
Subway
Burger King
Domino’s Pizza
Wendy’s
Dairy Queen
Popeyes
35
32
27
11
8
7
6
2
Source: The NPD Group, Inc.; NPD Foodworld; CREST
32