Pizza Hut 2006 Annual Report Download - page 34
Download and view the complete annual report
Please find page 34 of the 2006 Pizza Hut annual report below. You can navigate through the pages in the report by either clicking on the pages listed below, or by using the keyword search tool below to find specific information within the annual report.-
 1
1 -
2
-
3
-
4
-
5
-
6
-
7
-
8
-
9
-
10
-
11
-
12
-
13
-
14
-
15
-
16
-
17
-
18
-
19
-
20
-
21
-
22
-
23
-
 24
24 -
 25
25 -
 26
26 -
 27
27 -
 28
28 -
 29
29 -
 30
30 -
 31
31 -
 32
32 -
 33
33 -
 34
34 -
 35
35 -
 36
36 -
 37
37 -
 38
38 -
 39
39 -
 40
40 -
 41
41 -
 42
42 -
 43
43 -
 44
44 -
45
-
46
-
47
-
48
-
49
-
50
-
51
-
52
-
53
-
54
-
55
-
56
-
57
-
58
-
59
-
60
-
61
-
62
-
63
-
64
-
65
-
66
-
67
-
68
-
69
-
70
-
71
-
72
-
73
-
74
-
75
-
76
-
77
-
78
-
79
-
80
-
81
 |
 |

39
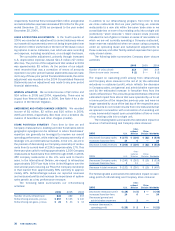
Excluding the favorable impact of the Pizza Hut U.K. acqui-
sition, worldwide Company sales were flat in 2006. Increases
from new unit development and same store sales growth were
offset by decreases in refranchising and store closures. In
2005, the increase in worldwide Company sales was driven by
new unit development and same store sales growth, partially
offset by refranchising and store closures.
In 2006 and 2005, the increase in worldwide franchise
and license fees was driven by new unit development, same
store sales growth and refranchising, partially offset by store
closures. In 2006, franchise and license fees were also nega-
tively impacted by the Pizza Hut U.K. acquisition.
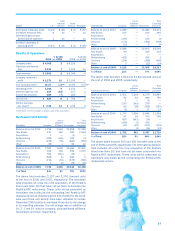
In 2006, the decrease in U.S. Company sales was driven
by refranchising and store closures, partially offset by new unit
development. In 2005, the increase in U.S. Company sales
was driven by same store sales growth and new unit develop-
ment, partially offset by refranchising and store closures.
In 2006, blended U.S. Company same store sales were
flat as a decrease in transactions was offset by an increase
in average guest check. In 2005, blended U.S. Company
same store sales increased 4% due to increases in aver-
age guest check and transactions. U.S. blended same store
sales includes KFC, Pizza Hut and Taco Bell Company-owned
restaurants only. U.S. same store sales for Long John Silver’s
and A&W restaurants are not included.
In 2006, the increase in U.S. franchise and license fees
was driven by new unit development, refranchising and same
store sales growth, partially offset by store closures. In 2005,
the increase in U.S. franchise and license fees was driven by
new unit development, same store sales growth and refran-
chising, partially offset by store closures.
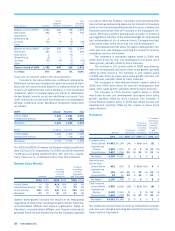
Excluding the favorable impact of the Pizza Hut U.K.
acquisition, International Division Company sales were flat in
2006. The impacts of refranchising and store closures were
partially offset by new unit development and same store sales
growth. In 2005, the decrease in International Division Com-
pany sales was driven by refranchising (primarily our Puerto
Rico business) and store closures, partially offset by new unit
development.
Excluding the unfavorable impact of the Pizza Hut U.K.
acquisition, International Division franchise and licenses fees
increased 13% in 2006. The increase was driven by new unit
development and same store growth, partially offset by store
closures. In 2005, the increase in International Division fran-
chise and license fees was driven by new unit development,
refranchising (primarily our Puerto Rico business) and royalty
rate increases.
In 2006, the increase in China Division Company sales
and franchise and licenses fees was driven by
new unit development and same store sales
growth. In 2005, the increase in China
Division Company sales and franchise
and licenses fees was driven by new
unit development, partially offset by
the impact of same store
sales declines.
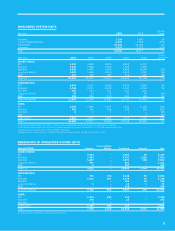
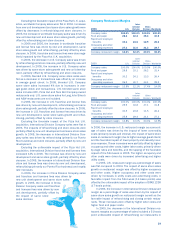
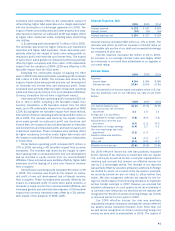
Company Restaurant Margins
Inter-
national China
2006 U.S. Division Division Worldwide
Company sales 100.0% 100.0% 100.0% 100.0%
Food and paper 28.2 32.2 35.4 30.5
Payroll and employee
benefits 30.1 24.6 12.9 25.6
Occupancy and other
operating expenses 27.1 31.0 31.3 28.7
Company restaurant margin 14.6% 12.2% 20.4% 15.2%
Inter-
national China
2005 U.S. Division Division Worldwide
Company sales 100.0% 100.0% 100.0% 100.0%
Food and paper 29.8 33.1 36.2 31.4
Payroll and employee
benefits 30.2 24.1 13.3 26.4
Occupancy and other
operating expenses 26.2 30.7 33.1 28.2
Company restaurant margin 13.8% 12.1% 17.4% 14.0%
Inter-
national China
2004 U.S. Division Division Worldwide
Company sales 100.0% 100.0% 100.0% 100.0%
Food and paper 29.9 33.8 37.1 31.8
Payroll and employee
benefits 30.5 23.8 11.5 26.4
Occupancy and other
operating expenses 25.8 29.4 31.1 27.3
Company restaurant margin 13.8% 13.0% 20.3% 14.5%
In 2006, the increase in U.S. restaurant margin as a percent-
age of sales was driven by the impact of lower commodity
costs (primarily meats and cheese), the impact of same store
sales on restaurant margin (due to higher average guest check)
and the favorable impact of lower property and casualty insur-
ance expense. These increases were partially offset by higher
occupancy and other costs, higher labor costs, primarily driven
by wage rates and benefits, and the lapping of the favorable
impact of the 53rd week in 2005. The higher occupancy and
other costs were driven by increased advertising and higher
utility costs.
In 2005, U.S. restaurant margin as a percentage of sales
was flat compared to 2004. The impact of same store sales
growth on restaurant margin was offset by higher occupancy
and other costs. Higher occupancy and other costs were
driven by increases in utility costs and advertising costs. A
favorable impact from the 53rd week (13 basis points) was
offset by the unfavorable impact of the adoption of SFAS 123R
(17 basis points).
In 2006, the increase in International Division restaurant
margin as a percentage of sales was driven by the impact of
same store sales growth on restaurant margin as well as the
favorable impact of refranchising and closing certain restau-
rants. These increases were offset by higher labor costs and
higher food and paper costs.
In 2005, the decrease in the International Division res-
taurant margins as a percentage of sales included a 51 basis
point unfavorable impact of refranchising our restaurants in