Pizza Hut 2006 Annual Report Download - page 33
Download and view the complete annual report
Please find page 33 of the 2006 Pizza Hut annual report below. You can navigate through the pages in the report by either clicking on the pages listed below, or by using the keyword search tool below to find specific information within the annual report.-
 1
1 -
2
-
3
-
4
-
5
-
6
-
7
-
8
-
9
-
10
-
11
-
12
-
13
-
14
-
15
-
16
-
17
-
18
-
19
-
20
-
21
-
22
-
 23
23 -
 24
24 -
 25
25 -
 26
26 -
 27
27 -
 28
28 -
 29
29 -
 30
30 -
 31
31 -
 32
32 -
 33
33 -
 34
34 -
 35
35 -
 36
36 -
 37
37 -
 38
38 -
 39
39 -
 40
40 -
 41
41 -
 42
42 -
 43
43 -
44
-
45
-
46
-
47
-
48
-
49
-
50
-
51
-
52
-
53
-
54
-
55
-
56
-
57
-
58
-
59
-
60
-
61
-
62
-
63
-
64
-
65
-
66
-
67
-
68
-
69
-
70
-
71
-
72
-
73
-
74
-
75
-
76
-
77
-
78
-
79
-
80
-
81
 |
 |

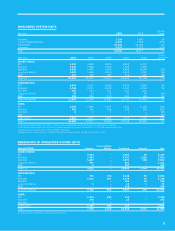
38 YUM! BRANDS, INC.
Uncon- Total
solidated Excluding
China Division Company Affiliates Franchisees Licensees
Balance at end of 2004 1,266 460 198 1,924
New Builds 292 99 18 409
Acquisitions — — — —
Refranchising (1) — 1 —
Closures (31) (7) (8) (46)
Other — — 4 4
Balance at end of 2005 1,526 552 213 2,291
New Builds 280 101 15 396
Acquisitions 1 — (1) —
Refranchising (2) — 2 —
Closures (43) (8) (4) (55)
Other — — (1) (1)
Balance at end of 2006 1,762 645 224 2,631
% of Total 67% 25% 8% 100%
There are no licensed units in the China Division.
Included in the above totals are multibrand restaurants.
Multibrand conversions increase the sales and points of distri-
bution for the second brand added to a restaurant but do not
result in an additional unit count. Similarly, a new multibrand
restaurant, while increasing sales and points of distribution
for two brands, results in just one additional unit count. Fran-
chise unit counts include both franchisee and unconsolidated
affiliate multibrand units. Multibrand restaurant totals were
as follows:
2006 Company Franchise Total
United States 1,802 1,631 3,433
International Division 11 192 203
Worldwide 1,813 1,823 3,636
2005 Company Franchise Total
United States 1,696 1,400 3,096
International Division 17 176 193
Worldwide 1,713 1,576 3,289
For 2006 and 2005, Company multibrand unit gross additions
were 212 and 373, respectively. For 2006 and 2005, franchise
multibrand unit gross additions were 197 and 171, respec-
tively. There are no multibrand units in the China Division.
System Sales Growth
Increase
Increase excluding
excluding currency
currency translation
Increase translation and 53rd week
2006 2005 2006 2005 2006 2005
United States —5% N/A N/A 1% 4%
International Division 7% 9% 7% 6% 9% 5%
China Division 26% 13% 23% 11% 23% 11%
Worldwide 4% 7% 4% 6% 5% 5%
System sales growth includes the results of all restaurants
regardless of ownership, including Company-owned, franchise,
unconsolidated affiliate and license restaurants. Sales of
franchise, unconsolidated affiliate and license restaurants
generate franchise and license fees for the Company (typically
at a rate of 4% to 6% of sales). Franchise, unconsolidated affili-
ate and license restaurants sales are not included in Company
sales on the Consolidated Statements of Income; however, the
franchise and license fees are included in the Company’s rev-
enues. We believe system sales growth is useful to investors
as a significant indicator of the overall strength of our business
as it incorporates all of our revenue drivers, Company and fran-
chise same store sales as well as net unit development.
The explanations that follow for system sales growth con-
sider year over year changes excluding the impact of currency
translation and the 53rd week.
The increases in worldwide system sales in 2006 and
2005 were driven by new unit development and same store
sales growth, partially offset by store closures.
The increase in U.S. system sales in 2006 was driven by
new unit development and same store sales growth, partially
offset by store closures. The increase in U.S. system sales
in 2005 was driven by same store sales growth and new unit
development, partially offset by store closures.
The increases in International Division system sales in
2006 and 2005 were driven by new unit development and
same store sales growth, partially offset by store closures.
The increase in China Division system sales in 2006
was driven by new unit development and same store sales
growth, partially offset by store closures. The increase in
China Division system sales in 2005 was driven by new unit
development, partially offset by the impact of same store
sales declines.
Revenues
% Increase
(Decrease)
% Increase excluding
(Decrease) currency
excluding translation
% Increase currency and
Amount (Decrease) translation 53rd week
2006 2005 2006 2005 2006 2005 2006 2005
Company sales
United States $ 4,952 $ 5,294 (6) 3N/A N/A (5) 1
International
Division 1,826 1,676 9(4) 8(8) 10 (10)
China Division 1,587 1,255 26 16 23 14 23 14
Worldwide 8,365 8,225 231221
Franchise and
license fees
United States 651 635 36N/A N/A 45
International
Division 494 448 10 17 10 15 11 14
China Division 51 41 25 821 721 7
Worldwide 1,196 1,124 710 6988
Total revenues
United States 5,603 5,929 (5) 3N/A N/A (4) 2
International
Division 2,320 2,124 9—9(4) 10 (5)
China Division 1,638 1,296 26 16 23 14 23 14
Worldwide $ 9,561 $ 9,349 242332
The explanations that follow for revenue fluctuations consider
year over year changes excluding the impact of currency trans-
lation and the 53rd week.