Pizza Hut 2006 Annual Report Download - page 52
Download and view the complete annual report
Please find page 52 of the 2006 Pizza Hut annual report below. You can navigate through the pages in the report by either clicking on the pages listed below, or by using the keyword search tool below to find specific information within the annual report.-
 1
1 -
2
-
3
-
4
-
5
-
6
-
7
-
8
-
9
-
10
-
11
-
12
-
13
-
14
-
15
-
16
-
17
-
18
-
19
-
20
-
21
-
22
-
23
-
24
-
25
-
26
-
27
-
28
-
29
-
30
-
31
-
32
-
33
-
34
-
35
-
36
-
37
-
38
-
39
-
40
-
41
-
 42
42 -
 43
43 -
 44
44 -
 45
45 -
 46
46 -
 47
47 -
 48
48 -
 49
49 -
 50
50 -
 51
51 -
 52
52 -
 53
53 -
 54
54 -
 55
55 -
 56
56 -
 57
57 -
 58
58 -
 59
59 -
 60
60 -
 61
61 -
 62
62 -
63
-
64
-
65
-
66
-
67
-
68
-
69
-
70
-
71
-
72
-
73
-
74
-
75
-
76
-
77
-
78
-
79
-
80
-
81
 |
 |

57
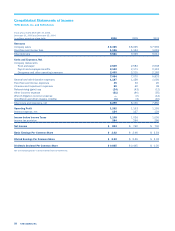
Consolidated Statements of Shareholders’ Equity and Comprehensive Income
YUM! Brands, Inc. and Subsidiaries
Accumulated
Fiscal years ended December 30, 2006, Other
December 31, 2005 and December 25, 2004 Issued Common Stock Retained Comprehensive
(in millions, except per share data) Shares Amount Earnings Income (Loss) Total
Balance at December 27, 2003 292 $ 916 $ 414 $ (210) $ 1,120
Net income 740 740
Foreign currency translation adjustment arising
during the period 73 73
Minimum pension liability adjustment (net of tax impact
of $3 million) 6 6
Comprehensive Income 819
Dividends declared on common shares
($0.30 per common share) (87) (87)
Repurchase of shares of common stock (14) (569) (569)
Employee stock option exercises (includes tax impact
of $102 million) 12 302 302
Compensation-related events 10 10
Balance at December 25, 2004 290 $ 659 $ 1,067 $ (131) $ 1,595
Net income 762 762
Foreign currency translation adjustment arising
during the period (31) (31)
Foreign currency translation adjustment included
in net income 6 6
Minimum pension liability adjustment (net of tax impact
of $8 million) (15) (15)
Net unrealized gain on derivative instruments
(net of tax impact of $1 million) 1 1
Comprehensive Income 723
Dividends declared on common shares
($0.445 per common share) (129) (129)
China December 2004 net income 6 6
Repurchase of shares of common stock (21) (969) (87) (1,056)
Employee stock option exercises (includes tax impact
of $94 million) 9 242 242
Compensation-related events 68 68
Balance at December 31, 2005 278 $ — $ 1,619 $ (170) $ 1,449
Adjustment to initially apply SAB No. 108 100 100
Net income 824 824
Foreign currency translation adjustment arising during
the period (includes tax impact of $13 million) 59 59
Minimum pension liability adjustment (net of tax impact
of $11 million) 17 17
Net unrealized gain on derivative instruments
(net of tax impact of $3 million) 5 5
Comprehensive Income 905
Adjustment to initially apply SFAS No. 158 (net of tax
impact of $37 million) (67) (67)
Dividends declared on common shares
($0.865 per common share) (234) (234)
Repurchase of shares of common stock (20) (284) (716) (1,000)
Employee stock option exercises (includes tax impact
of $68 million) 7 210 210
Compensation-related events 74 74
Balance at December 30, 2006 265 $ — $ 1,593 $ (156) $ 1,437
See accompanying Notes to Consolidated Financial Statements.