Pizza Hut 2006 Annual Report Download - page 37
Download and view the complete annual report
Please find page 37 of the 2006 Pizza Hut annual report below. You can navigate through the pages in the report by either clicking on the pages listed below, or by using the keyword search tool below to find specific information within the annual report.-
 1
1 -
2
-
3
-
4
-
5
-
6
-
7
-
8
-
9
-
10
-
11
-
12
-
13
-
14
-
15
-
16
-
17
-
18
-
19
-
20
-
21
-
22
-
23
-
24
-
25
-
26
-
 27
27 -
 28
28 -
 29
29 -
 30
30 -
 31
31 -
 32
32 -
 33
33 -
 34
34 -
 35
35 -
 36
36 -
 37
37 -
 38
38 -
 39
39 -
 40
40 -
 41
41 -
 42
42 -
 43
43 -
 44
44 -
 45
45 -
 46
46 -
 47
47 -
48
-
49
-
50
-
51
-
52
-
53
-
54
-
55
-
56
-
57
-
58
-
59
-
60
-
61
-
62
-
63
-
64
-
65
-
66
-
67
-
68
-
69
-
70
-
71
-
72
-
73
-
74
-
75
-
76
-
77
-
78
-
79
-
80
-
81
 |
 |

42 YUM! BRANDS, INC.
these items was partially offset by tax expense associated
with our 2005 decision to repatriate approximately $390 mil-
lion in qualified foreign earnings. These earnings, as well as
$110 million for which a determination was made to repatriate
in 2004, were eligible for a dividends received deduction in
accordance with the American Jobs Creation Act of 2004.
Our 2004 effective income tax rate was positively
impacted by the reversal of tax reserves in connection with
our regular U.S. audit cycle, partially offset by the recognition
of valuation allowances for certain deferred tax assets whose
realization was no longer considered more likely than not.
Adjustments to reserves and prior years include the
effects of the reconciliation of income tax amounts recorded in
our Consolidated Statements of Income to amounts reflected
on our tax returns, including any adjustments to the Con-
solidated Balance Sheets. Adjustments to reserves and prior
years also includes changes in tax reserves established for
potential exposure we may incur if a taxing authority takes
a position on a matter contrary to our position. We evalu-
ate these reserves, including interest thereon, on a quarterly
basis to insure that they have been appropriately adjusted
for events, including audit settlements that we believe may
impact our exposure.
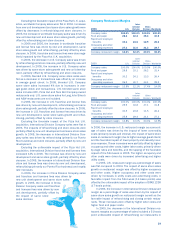
Consolidated Cash Flows
Net cash provided by operating activities was $1,302 mil-
lion compared to $1,238 million in 2005. The increase was
driven by a higher net income, lower pension contributions and
a 2006 partial receipt of the settlement related to the 2005
mainland China supplier ingredient issue. These factors were
offset by higher income tax and interest payments in 2006.
In 2005, net cash provided by operating activities was
$1,238 million compared to $1,186 million in 2004. The
increase was driven primarily by an increase in net income,
including the non-cash impact of the adoption of SFAS 123R,
and lower income tax payments in 2005, partially offset by the
impact of excess tax benefits from share-based compensa-
tion classified in financing activities in 2005 pursuant to the
adoption of SFAS 123R.
Net cash used in investing activities was $476 million
versus $345 million in 2005. The increase was driven by the
current year acquisitions of the remaining interest in our Pizza
Hut U.K. unconsolidated affiliate and the Rostik’s brand and
associated intellectual properties in Russia. The lapping of
proceeds related to the 2005 sale of our fifty percent inter-
est in our former Poland/Czech Republic unconsolidated
affiliate also contributed to the increase. These factors were
partially offset by an increase in proceeds from refranchising
in 2006.
In 2005, net cash used in investing activities was
$345 million versus $541 million in 2004. The decrease was
primarily driven by lower acquisitions of restaurants from fran-
chisees and capital spending, higher proceeds from the sale
of property, plant and equipment versus 2004 and the pro-
ceeds from the sale of our fifty percent interest in our former
Poland/Czech Republic unconsolidated affiliate.
Net cash used in financing activities was $673 million
versus $832 million in 2005. The decrease was driven by
an increase in net borrowings and lower share repurchases,
partially offset by a reduction in the excess tax benefits from
share-based compensation and higher dividend payments.
In 2005, net cash used in financing activities was
$832 million versus $779 million in 2004. The increase was
driven primarily by higher share repurchases, partially offset
by net debt borrowings in 2005 versus net debt repayments
in 2004 and the impact of excess tax benefits from share-
based compensation classified in financing activities in 2005
pursuant to the adoption of SFAS 123R.
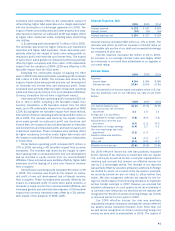
Liquidity and Capital Resources
Operating in the QSR industry allows us to generate substan-
tial cash flows from the operations of our company stores
and from our franchise operations, which require a limited
YUM investment. In each of the last five fiscal years, net cash
provided by operating activities has exceeded $1 billion. We
expect these levels of net cash provided by operating activities
to continue in the foreseeable future. Our discretionary spend-
ing includes capital spending for new restaurants, acquisitions
of restaurants from franchisees, repurchases of shares of
our common stock and dividends paid to our shareholders.
Unforeseen downturns in our business could adversely impact
our cash flows from operations from the levels historically real-
ized. However, we believe our ability to reduce discretionary
spending and our borrowing capacity would allow us to meet
our cash requirements in 2007 and beyond.
DISCRETIONARY SPENDING During 2006, we invested
$614 million in our businesses, including approximately
$331 million in the U.S., $118 million for the International
Division and $165 million for the China Division. We also
acquired the remaining fifty percent ownership interest of
our Pizza Hut United Kingdom unconsolidated affiliate for
$178 million in cash.
For the second straight year, we returned over $1.1 billion
to our shareholders through share repurchases and quarterly
dividends. Under the authority of our Board of Directors, we
repurchased 20.2 million shares of our Common Shares for
$983 million during 2006. In September 2006, the Board of
Directors authorized share repurchases of up to $500 mil-
lion of the Company’s outstanding common stock (excluding
applicable transaction fees) to be purchased through Septem-
ber 2007. At December 30, 2006, we had remaining capacity
to repurchase up to $469 million of our outstanding common
stock (excluding applicable transaction fees) under the Sep-
tember 2006 authorization.
During the year ended December 30, 2006, we paid cash
dividends of $144 million. Additionally, on November 17, 2006
and December 5, 2006, our Board of Directors approved
cash dividends of $0.15 and $0.30, respectively, per share
of common stock to be distributed on February 2, 2007 and
March 30, 2007, respectively, to shareholders of record at
the close of business on January 12, 2007 and March 9,
2007, respectively.
For 2007, we estimate that capital spending will be
approximately $650 million. We also estimate that refran-
chising proceeds, prior to taxes, will total approximately
$200 million in 2007. We also expect to provide returns to
our shareholders through both significant share repurchases