Pizza Hut 2006 Annual Report Download - page 31
Download and view the complete annual report
Please find page 31 of the 2006 Pizza Hut annual report below. You can navigate through the pages in the report by either clicking on the pages listed below, or by using the keyword search tool below to find specific information within the annual report.-
 1
1 -
2
-
3
-
4
-
5
-
6
-
7
-
8
-
9
-
10
-
11
-
12
-
13
-
14
-
15
-
16
-
17
-
18
-
19
-
20
-
 21
21 -
 22
22 -
 23
23 -
 24
24 -
 25
25 -
 26
26 -
 27
27 -
 28
28 -
 29
29 -
 30
30 -
 31
31 -
 32
32 -
 33
33 -
 34
34 -
 35
35 -
 36
36 -
 37
37 -
 38
38 -
 39
39 -
 40
40 -
 41
41 -
42
-
43
-
44
-
45
-
46
-
47
-
48
-
49
-
50
-
51
-
52
-
53
-
54
-
55
-
56
-
57
-
58
-
59
-
60
-
61
-
62
-
63
-
64
-
65
-
66
-
67
-
68
-
69
-
70
-
71
-
72
-
73
-
74
-
75
-
76
-
77
-
78
-
79
-
80
-
81
 |
 |

36 YUM! BRANDS, INC.
respectively, franchise fees increased $10 million and general
and administrative expenses decreased $9 million for the year
ended December 31, 2005 as compared to the year ended
December 25, 2004.
LEASE ACCOUNTING ADJUSTMENTS In the fourth quarter of
2004, we recorded an adjustment to correct instances where
our leasehold improvements were not being depreciated over
the shorter of their useful lives or the term of the lease, includ-
ing options in some instances, over which we were recording
rent expense, including escalations, on a straight-line basis.
The cumulative adjustment, primarily through increased
U.S. depreciation expense, totaled $11.5 million ($7 million
after tax). The portion of this adjustment that related to 2004
was approximately $3 million. As the portion of our adjust-
ment recorded that was a correction of errors of amounts
reported in our prior period financial statements was not mate-
rial to any of those prior period financial statements, the entire
adjustment was recorded in the 2004 Consolidated Financial
Statements and no adjustment was made to any prior period
financial statements.
WRENCH LITIGATION We recorded income of $2 million and
$14 million in 2005 and 2004, respectively. There was no
impact from Wrench litigation in 2006. See Note 4 for a dis-
cussion of the Wrench litigation.
AMERISERVE AND OTHER CHARGES (CREDITS) We recorded
income of $1 million, $2 million and $16 million in 2006,
2005 and 2004, respectively. See Note 4 for a detailed dis-
cussion of AmeriServe and other charges (credits).
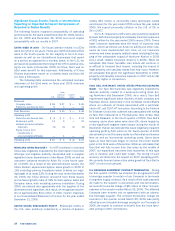
STORE PORTFOLIO STRATEGY From time to time we sell
Company restaurants to existing and new franchisees where
geographic synergies can be obtained or where franchisees’
expertise can generally be leveraged to improve our overall
operating performance, while retaining Company ownership of
strategic U.S. and international markets. In the U.S., we are in
the process of decreasing our Company ownership of restau-
rants from its current level of 23% to approximately 17%. This
three-year plan calls for selling approximately 1,500 Company
restaurants to franchisees from 2006 through 2008. In 2006,
452 company restaurants in the U.S. were sold to franchi-
sees. In the International Division, we expect to refranchise
approximately 300 Pizza Huts in the United Kingdom over the
next several years reducing our Pizza Hut Company ownership
in that market from approximately 80% currently to approxi-
mately 40%. Refranchisings reduce our reported revenues
and restaurant profits and increase the importance of system
sales growth as a key performance measure.
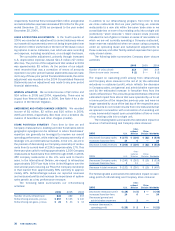
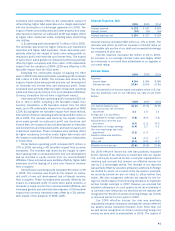
The following table summarizes our refranchising
activities:
2006 2005 2004
Number of units refranchised 622 382 317
Refranchising proceeds, pre-tax $ 257 $ 145 $ 140
Refranchising net gains, pre-tax $24 $43 $12
In addition to our refranchising program, from time to time
we close restaurants that are poor performing, we relocate
restaurants to a new site within the same trade area or we
consolidate two or more of our existing units into a single unit
(collectively “store closures”). Store closure costs (income)
includes the net of gains or losses on sales of real estate on
which we are not currently operating a Company restaurant,
lease reserves established when we cease using a property
under an operating lease and subsequent adjustments to
those reserves, and other facility-related expenses from previ-
ously closed stores.
The following table summarizes Company store closure
activities:
2006 2005 2004
Number of units closed 214 246 319
Store closure costs (income) $ (1) $— $(3)
The impact on operating profit arising from refranchising
and Company store closures is the net of (a) the estimated
reductions in restaurant profit, which reflects the decrease
in Company sales, and general and administrative expenses
and (b) the estimated increase in franchise fees from the
stores refranchised. The amounts presented below reflect the
estimated impact from stores that were operated by us for all
or some portion of the respective previous year and were no
longer operated by us as of the last day of the respective year.
The amounts do not include results from new restaurants that
we opened in connection with a relocation of an existing unit
or any incremental impact upon consolidation of two or more
of our existing units into a single unit.
The following table summarizes the estimated impact on
revenue of refranchising and Company store closures:
Inter-
national China
2006 U.S. Division Division Worldwide
Decreased Company sales $ (377) $ (136) $ (22) $ (535)
Increased franchise fees 14 6 — 20
Decrease in total revenues $ (363) $ (130) $ (22) $ (515)
Inter-
national China
2005 U.S. Division Division Worldwide
Decreased Company sales $ (240) $ (263) $ (15) $ (518)
Increased franchise fees 8 13 — 21
Decrease in total revenues $ (232) $ (250) $ (15) $ (497)
The following table summarizes the estimated impact on oper-
ating profit of refranchising and Company store closures:
Inter-
national China
2006 U.S. Division Division Worldwide
Decreased restaurant profit $ (38) $ (5) $ — $ (43)
Increased franchise fees 14 6 — 20
Decreased general and
administrative expenses 1 1 — 2
Increase (decrease) in
operating profit $ (23) $ 2 $ — $ (21)