Pizza Hut 2006 Annual Report Download - page 70
Download and view the complete annual report
Please find page 70 of the 2006 Pizza Hut annual report below. You can navigate through the pages in the report by either clicking on the pages listed below, or by using the keyword search tool below to find specific information within the annual report.-
 1
1 -
2
-
3
-
4
-
5
-
6
-
7
-
8
-
9
-
10
-
11
-
12
-
13
-
14
-
15
-
16
-
17
-
18
-
19
-
20
-
21
-
22
-
23
-
24
-
25
-
26
-
27
-
28
-
29
-
30
-
31
-
32
-
33
-
34
-
35
-
36
-
37
-
38
-
39
-
40
-
41
-
42
-
43
-
44
-
45
-
46
-
47
-
48
-
49
-
50
-
51
-
52
-
53
-
54
-
55
-
56
-
57
-
58
-
59
-
 60
60 -
 61
61 -
 62
62 -
 63
63 -
 64
64 -
 65
65 -
 66
66 -
 67
67 -
 68
68 -
 69
69 -
 70
70 -
 71
71 -
 72
72 -
 73
73 -
 74
74 -
 75
75 -
 76
76 -
 77
77 -
 78
78 -
 79
79 -
 80
80 -
81
 |
 |

75
The reconciliation of income taxes calculated at the U.S. fed-
eral tax statutory rate to our effective tax rate is set forth below:
2006 2005 2004
U.S. federal statutory rate 35.0% 35.0% 35.0%
State income tax, net of federal
tax benefit 2.0 1.6 1.3
Foreign and U.S. tax effects
attributable to foreign operations (7.8) (8.4) (7.8)
Adjustments to reserves and
prior years (3.5) (1.1) (6.7)
Repatriation of foreign earnings (0.4) 2.0 0.5
Non-recurring foreign tax credit
adjustments (6.2) (1.7) —
Valuation allowance additions
(reversals) 6.8 (1.1) 5.7
Other, net (0.3) (0.5) (0.1)
Effective income tax rate 25.6% 25.8% 27.9%
The 2006 tax rate was favorably impacted by the reversal of tax
reserves in connection with our regular U.S. audit cycle, as well
as certain out-of-year adjustments to reserves and accruals that
lowered our effective income tax rate by 2.2 percentage points.
The reversal of tax reserves was partially offset by valuation allow-
ance additions on foreign tax credits of approximately $36 million
for which, as a result of the tax reserve reversals, we currently
believe we are not likely to utilize before they expire. We also
recognized deferred tax assets for the foreign tax credit impact
of non-recurring decisions to repatriate certain foreign earnings
in 2007. However, we provided full valuation allowances on such
assets as we do not believe it is currently more likely than not that
they will be realized. The 2005 tax rate was favorably impacted by
the reversal of valuation allowances and the recognition of certain
non-recurring foreign tax credits that we were able to substantiate
during 2005. The 2004 adjustment to reserves and prior years
were primarily driven by the reversal of reserves associated with
audits that were settled.
Adjustments to reserves and prior years include the effects
of the reconciliation of income tax amounts recorded in our Con-
solidated Statements of Income to amounts reflected on our tax
returns, including any adjustments to the Consolidated Balance
Sheets. Adjustments to reserves and prior years also includes
changes in tax reserves established for potential exposure we
may incur if a taxing authority takes a position on a matter contrary
to our position. We evaluate these reserves, including interest
thereon, on a quarterly basis to insure that they have been appro-
priately adjusted for events, including audit settlements that we
believe may impact our exposure.
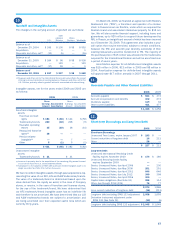
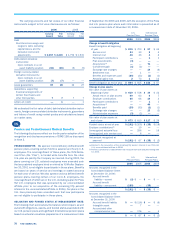
The details of 2006 and 2005 deferred tax liabilities (assets)
are set forth below:
2006 2005
Intangible assets and property, plant and
equipment $ 150 $ 169
Other 55 62
Gross deferred tax liabilities $ 205 $ 231
Net operating loss and tax credit carryforwards $ (331) $ (234)
Employee benefits (174) (132)
Self-insured casualty claims (85) (84)
Lease related assets and liabilities (72) (50)
Various liabilities (92) (151)
Deferred income and other (70) (49)
Gross deferred tax assets (824) (700)
Deferred tax asset valuation allowances 342 233
Net deferred tax assets (482) (467)
Net deferred tax (assets) liabilities $ (277) $ (236)
Reported in Consolidated Balance Sheets as:
Deferred income taxes — current $ (57) $ (181)
Deferred income taxes — long-term (305) (225)
Other liabilities and deferred credits 77 111
Accounts payable and other current liabilities 8 59
$ (277) $ (236)
We have not provided deferred tax on the undistributed earnings
from our foreign subsidiaries as we believe they are indefinitely
reinvested. This amount may become taxable upon an actual or
deemed repatriation of assets from the subsidiaries or a sale or
liquidation of the subsidiaries. In 2006 we recorded the impact
of $48 million of excess foreign tax credits to be generated from
decisions to repatriate foreign earnings; however, these benefits
are fully offset by a valuation allowance. We estimate that our
total net undistributed earnings upon which we have not provided
deferred tax total approximately $830 million at December 30,
2006. A determination of the deferred tax liability on such earn-
ings is not practicable.
Foreign operating and capital loss carryforwards totaling
$467 million and state operating loss carryforwards of $1.1 bil-
lion at year end 2006 are being carried forward in jurisdictions
where we are permitted to use tax losses from prior periods
to reduce future taxable income. These losses will expire as
follows: $13 million in 2007, $1.2 billion between 2007 and
2026 and $395 million may be carried forward indefinitely. In
addition, tax credits totaling $127 million are available to reduce
certain federal and state liabilities, of which $121 million will
expire between 2007 and 2026 and $6 million may be carried
forward indefinitely.
See Note 22 for further discussion of certain proposed Inter-
nal Revenue Service adjustments.
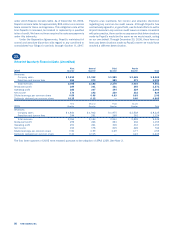
21.
Reportable Operating Segments
We are principally engaged in developing, operating, franchising
and licensing the worldwide KFC, Pizza Hut and Taco Bell con-
cepts, and since May 7, 2002, the LJS and A&W concepts, which
were added when we acquired YGR. KFC, Pizza Hut, Taco Bell, LJS
and A&W operate throughout the U.S. and in 101, 91, 13, 5 and
10 countries and territories outside the U.S., respectively. Our five
largest international markets based on operating profit in 2006
are China, United Kingdom, Asia Franchise, Australia and Mexico.