Oracle 2007 Annual Report Download - page 75
Download and view the complete annual report
Please find page 75 of the 2007 Oracle annual report below. You can navigate through the pages in the report by either clicking on the pages listed below, or by using the keyword search tool below to find specific information within the annual report.-
 1
1 -
2
-
3
-
4
-
5
-
6
-
7
-
8
-
9
-
10
-
11
-
12
-
13
-
14
-
15
-
16
-
17
-
18
-
19
-
20
-
21
-
22
-
23
-
24
-
25
-
26
-
27
-
28
-
29
-
30
-
31
-
32
-
33
-
34
-
35
-
36
-
37
-
38
-
39
-
40
-
41
-
42
-
43
-
44
-
45
-
46
-
47
-
48
-
49
-
50
-
51
-
52
-
53
-
54
-
55
-
56
-
57
-
58
-
59
-
60
-
61
-
62
-
63
-
64
-
 65
65 -
 66
66 -
 67
67 -
 68
68 -
 69
69 -
 70
70 -
 71
71 -
 72
72 -
 73
73 -
 74
74 -
 75
75 -
 76
76 -
 77
77 -
 78
78 -
 79
79 -
 80
80 -
 81
81 -
 82
82 -
 83
83 -
 84
84 -
 85
85 -
86
-
87
-
88
-
89
-
90
-
91
-
92
-
93
-
94
-
95
-
96
-
97
-
98
-
99
-
100
-
101
-
102
-
103
-
104
-
105
-
106
-
107
-
108
-
109
-
110
-
111
-
112
-
113
-
114
-
115
-
116
-
117
-
118
-
119
-
120
-
121
-
122
-
123
-
124
-
125
-
126
-
127
-
128
-
129
-
130
-
131
-
132
-
133
-
134
-
135
-
136
 |
 |

Table of Contents
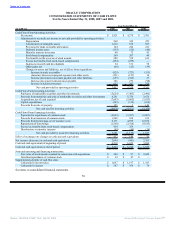
ORACLE CORPORATION
CONSOLIDATED STATEMENTS OF CASH FLOWS
For the Years Ended May 31, 2008, 2007 and 2006
Year Ended May 31,
(in millions) 2008 2007 2006
Cash Flows From Operating Activities:
Net income $ 5,521 $ 4,274 $ 3,381
Adjustments to reconcile net income to net cash provided by operating activities:
Depreciation 268 249 223
Amortization of intangible assets 1,212 878 583
Provision for trade receivable allowances 164 244 241
Deferred income taxes (135) (56) (40)
Minority interests in income 60 71 41
Stock-based compensation 369 207 49
Tax benefits on the exercise of stock awards 588 338 162
Excess tax benefits from stock-based compensation (454) (259) —
In-process research and development 24 151 78
Other gains, net (66) (22) (39)
Changes in assets and liabilities, net of effects from acquisitions:
Increase in trade receivables (825) (723) (355)
(Increase) decrease in prepaid expenses and other assets (191) (153) 14
Increase (decrease) in accounts payable and other liabilities (153) (345) 23
Increase (decrease) in income taxes payable 368 279 (98)
Increase in deferred revenues 652 387 278
Net cash provided by operating activities 7,402 5,520 4,541
Cash Flows From Investing Activities:
Purchases of marketable securities and other investments (5,624) (5,405) (2,986)
Proceeds from maturities and sales of marketable securities and other investments 4,281 5,756 3,676
Acquisitions, net of cash acquired (7,643) (5,005) (3,953)
Capital expenditures (243) (319) (236)
Proceeds from sale of property 153 2 140
Net cash used for investing activities (9,076) (4,971) (3,359)
Cash Flows From Financing Activities:
Payments for repurchases of common stock (2,023) (3,937) (2,067)
Proceeds from issuances of common stock 1,288 924 632
Proceeds from borrowings, net of issuance costs 6,171 4,079 12,636
Repayments of borrowings (2,560) (2,418) (9,635)
Excess tax benefits from stock-based compensation 454 259 —
Distributions to minority interests (49) (46) (39)
Net cash provided by (used for) financing activities 3,281 (1,139) 1,527
Effect of exchange rate changes on cash and cash equivalents 437 149 56
Net increase (decrease) in cash and cash equivalents 2,044 (441) 2,765
Cash and cash equivalents at beginning of period 6,218 6,659 3,894
Cash and cash equivalents at end of period $ 8,262 $ 6,218 $ 6,659
Non-cash investing and financing transactions:
Fair value of stock awards assumed in connection with acquisitions $ 240 $ 97 $ 2,042
Unsettled repurchases of common stock $ 24 $ 47 $ —
Supplemental schedule of cash flow data:
Cash paid for income taxes $ 1,687 $ 1,197 $ 1,413
Cash paid for interest $ 347 $ 354 $ 74
See notes to consolidated financial statements.
70
Source: ORACLE CORP, 10-K, July 02, 2008 Powered by Morningstar® Document Research℠