Oracle 2007 Annual Report Download - page 41
Download and view the complete annual report
Please find page 41 of the 2007 Oracle annual report below. You can navigate through the pages in the report by either clicking on the pages listed below, or by using the keyword search tool below to find specific information within the annual report.-
 1
1 -
2
-
3
-
4
-
5
-
6
-
7
-
8
-
9
-
10
-
11
-
12
-
13
-
14
-
15
-
16
-
17
-
18
-
19
-
20
-
21
-
22
-
23
-
24
-
25
-
26
-
27
-
28
-
29
-
30
-
 31
31 -
 32
32 -
 33
33 -
 34
34 -
 35
35 -
 36
36 -
 37
37 -
 38
38 -
 39
39 -
 40
40 -
 41
41 -
 42
42 -
 43
43 -
 44
44 -
 45
45 -
 46
46 -
 47
47 -
 48
48 -
 49
49 -
 50
50 -
 51
51 -
52
-
53
-
54
-
55
-
56
-
57
-
58
-
59
-
60
-
61
-
62
-
63
-
64
-
65
-
66
-
67
-
68
-
69
-
70
-
71
-
72
-
73
-
74
-
75
-
76
-
77
-
78
-
79
-
80
-
81
-
82
-
83
-
84
-
85
-
86
-
87
-
88
-
89
-
90
-
91
-
92
-
93
-
94
-
95
-
96
-
97
-
98
-
99
-
100
-
101
-
102
-
103
-
104
-
105
-
106
-
107
-
108
-
109
-
110
-
111
-
112
-
113
-
114
-
115
-
116
-
117
-
118
-
119
-
120
-
121
-
122
-
123
-
124
-
125
-
126
-
127
-
128
-
129
-
130
-
131
-
132
-
133
-
134
-
135
-
136
 |
 |

Table of Contents
We caution readers that, while pre- and post-acquisition comparisons as well as the quantified amounts
themselves may provide indications of general trends, the information has inherent limitations for the
following reasons:
• The quantifications cannot address the substantial effects attributable to our sales force integration
efforts, in particular the effect of having a single sales force offer similar products. We believe that if
our sales forces had not been integrated, the relative mix of products sold would have been different.
• Our acquisitions in the periods presented did not result in our entry into a new line of business or
product category. Therefore, we provided multiple products with substantially similar features and
functionality.
• Although substantially all of our customers, including customers from acquired companies, renew their
software license updates and product support contracts when the contracts are eligible for renewal,
amounts shown as support deferred revenue in our supplemental disclosure related to certain charges
and gains (see below) are not necessarily indicative of revenue improvements we will achieve upon
contract renewal to the extent customers do not renew.
Constant Currency Presentation
We compare the percent change in the results from one period to another period in this annual report using
constant currency disclosure. We present constant currency information to provide a framework for assessing
how our underlying businesses performed excluding the effect of foreign currency rate fluctuations. To
present this information, current and comparative prior period results for entities reporting in currencies other
than U.S. Dollars are converted into U.S. Dollars at the exchange rate in effect on May 31, 2007, which was
the last day of our prior fiscal year, rather than the actual exchange rates in effect during the respective
periods. For example, if an entity reporting in Euros had revenues of 1.0 million Euros from products sold on
May 31, 2008 and May 31, 2007, our financial statements would reflect revenues of $1.57 million in fiscal
2008 (using 1.57 as the exchange rate) and $1.35 million in fiscal 2007 (using 1.35 as the exchange rate). The
constant currency presentation would translate the fiscal 2008 results using the fiscal 2007 exchange rate and
indicate, in this example, no change in revenues during the period. In each of the tables below, we present the
percent change based on actual results as reported and based on constant currency.
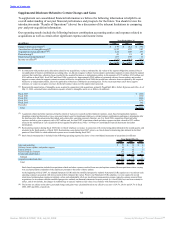
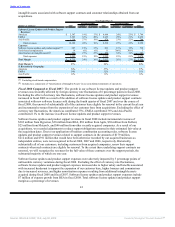
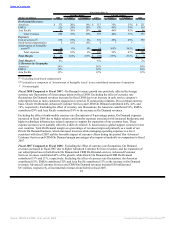
Total Revenues and Operating Expenses
Year Ended May 31,
Percent Change Percent Change
(Dollars in millions) 2008 Actual Constant 2007 Actual Constant 2006
Total Revenues by
Geography:
Americas $ 11,330 20% 18% $ 9,460 24% 23% $ 7,652
EMEA(1) 7,945 32% 20% 6,037 28% 20% 4,708
Asia Pacific 3,155 26% 18% 2,499 24% 21% 2,020
Total revenues 22,430 25% 19% 17,996 25% 22% 14,380
Total Operating Expenses 14,586 21% 17% 12,022 25% 22% 9,644
Total Operating Margin $ 7,844 31% 22% $ 5,974 26% 21% $ 4,736
Total Operating Margin % 35% 33% 33%
% Revenues by Geography:
Americas 51% 53% 53%
EMEA(1) 35% 34% 33%
Asia Pacific 14% 13% 14%
Total Revenues by Business:
Software $ 17,843 26% 19% $ 14,211 23% 20% $ 11,541
Services 4,587 21% 15% 3,785 33% 29% 2,839
Total revenues $ 22,430 25% 19% $ 17,996 25% 22% $ 14,380
% Revenues by Business:
Software 80% 79% 80%
Services 20% 21% 20%
(1) Comprised of Europe, the Middle East and Africa
36
Source: ORACLE CORP, 10-K, July 02, 2008 Powered by Morningstar® Document Research℠