Oracle 2007 Annual Report Download - page 111
Download and view the complete annual report
Please find page 111 of the 2007 Oracle annual report below. You can navigate through the pages in the report by either clicking on the pages listed below, or by using the keyword search tool below to find specific information within the annual report.-
 1
1 -
2
-
3
-
4
-
5
-
6
-
7
-
8
-
9
-
10
-
11
-
12
-
13
-
14
-
15
-
16
-
17
-
18
-
19
-
20
-
21
-
22
-
23
-
24
-
25
-
26
-
27
-
28
-
29
-
30
-
31
-
32
-
33
-
34
-
35
-
36
-
37
-
38
-
39
-
40
-
41
-
42
-
43
-
44
-
45
-
46
-
47
-
48
-
49
-
50
-
51
-
52
-
53
-
54
-
55
-
56
-
57
-
58
-
59
-
60
-
61
-
62
-
63
-
64
-
65
-
66
-
67
-
68
-
69
-
70
-
71
-
72
-
73
-
74
-
75
-
76
-
77
-
78
-
79
-
80
-
81
-
82
-
83
-
84
-
85
-
86
-
87
-
88
-
89
-
90
-
91
-
92
-
93
-
94
-
95
-
96
-
97
-
98
-
99
-
100
-
 101
101 -
 102
102 -
 103
103 -
 104
104 -
 105
105 -
 106
106 -
 107
107 -
 108
108 -
 109
109 -
 110
110 -
 111
111 -
 112
112 -
 113
113 -
 114
114 -
 115
115 -
 116
116 -
 117
117 -
 118
118 -
 119
119 -
 120
120 -
 121
121 -
122
-
123
-
124
-
125
-
126
-
127
-
128
-
129
-
130
-
131
-
132
-
133
-
134
-
135
-
136
 |
 |

Table of Contents
ORACLE CORPORATION
NOTES TO CONSOLIDATED FINANCIAL STATEMENTS—(Continued)
May 31, 2008
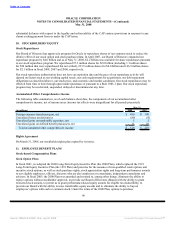
software. On Demand includes Oracle On Demand, CRM On Demand and Advanced Customer Services.
Oracle On Demand provides multi-featured software and hardware management and maintenance services for
customers that deploy our database, middleware and applications software either at our data center facilities,
at select partner data centers or at customer facilities. CRM On Demand is a service offering that provides our
customers with our CRM Software functionality delivered via a hosted solution that we manage. Advanced
Customer Services consists of solution support centers, business critical assistance, technical account
management, expert services, configuration and performance analysis, personalized support and annual
on-site technical services. The education line of business provides instructor led, media based and internet
based training in the use of our database, middleware and applications software.
We do not track our assets by operating segments. Consequently, it is not practical to show assets by
operating segments.
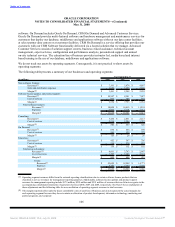
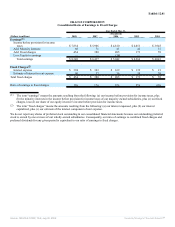
The following table presents a summary of our businesses and operating segments:
Year Ended May 31,
(in millions) 2008 2007 2006
New software licenses:
Revenues(1) $ 7,501 $ 5,874 $ 4,897
Sales and distribution expenses 4,040 3,326 2,638
Margin(2) $ 3,461 $ 2,548 $ 2,259
Software license updates and product support:
Revenues(1) $ 10,507 $ 8,541 $ 7,027
Cost of services 933 788 673
Margin(2) $ 9,574 $ 7,753 $ 6,354
Total software business:
Revenues(1) $ 18,008 $ 14,415 $ 11,924
Expenses 4,973 4,114 3,311
Margin(2) $ 13,035 $ 10,301 $ 8,613
Consulting:
Revenues(1) $ 3,454 $ 2,851 $ 2,113
Cost of services 2,914 2,384 1,787
Margin(2) $ 540 $ 467 $ 326
On Demand:
Revenues(1) $ 695 $ 555 $ 398
Cost of services 569 529 372
Margin(2) $ 126 $ 26 $ 26
Education:
Revenues(1) $ 452 $ 387 $ 336
Cost of services 314 272 235
Margin(2) $ 138 $ 115 $ 101
Total services business:
Revenues(1) $ 4,601 $ 3,793 $ 2,847
Cost of services 3,797 3,185 2,394
Margin(2) $ 804 $ 608 $ 453
Totals:
Revenues(1) $ 22,609 $ 18,208 $ 14,771
Expenses 8,770 7,299 5,705
Margin(2) $ 13,839 $ 10,909 $ 9,066
(1) Operating segment revenues differ from the external reporting classifications due to certain software license products that are
classified as service revenues for management reporting purposes. Additionally, software license updates and product support
revenues for management reporting include $179 million, $212 million and $391 million of revenues that we did not recognize in the
accompanying consolidated statements of operations for fiscal 2008, 2007 and 2006, respectively. See Note 8 for an explanation of
these adjustments and the following table for a reconciliation of operating segment revenues to total revenues.
(2) The margins reported reflect only the direct controllable costs of each line of business and do not represent the actual margins for
each operating segment because they do not contain an allocation of product development, information technology, marketing and
partner programs, and corporate
106
Source: ORACLE CORP, 10-K, July 02, 2008 Powered by Morningstar® Document Research℠