Oracle 2007 Annual Report Download - page 49
Download and view the complete annual report
Please find page 49 of the 2007 Oracle annual report below. You can navigate through the pages in the report by either clicking on the pages listed below, or by using the keyword search tool below to find specific information within the annual report.-
 1
1 -
2
-
3
-
4
-
5
-
6
-
7
-
8
-
9
-
10
-
11
-
12
-
13
-
14
-
15
-
16
-
17
-
18
-
19
-
20
-
21
-
22
-
23
-
24
-
25
-
26
-
27
-
28
-
29
-
30
-
31
-
32
-
33
-
34
-
35
-
36
-
37
-
38
-
 39
39 -
 40
40 -
 41
41 -
 42
42 -
 43
43 -
 44
44 -
 45
45 -
 46
46 -
 47
47 -
 48
48 -
 49
49 -
 50
50 -
 51
51 -
 52
52 -
 53
53 -
 54
54 -
 55
55 -
 56
56 -
 57
57 -
 58
58 -
 59
59 -
60
-
61
-
62
-
63
-
64
-
65
-
66
-
67
-
68
-
69
-
70
-
71
-
72
-
73
-
74
-
75
-
76
-
77
-
78
-
79
-
80
-
81
-
82
-
83
-
84
-
85
-
86
-
87
-
88
-
89
-
90
-
91
-
92
-
93
-
94
-
95
-
96
-
97
-
98
-
99
-
100
-
101
-
102
-
103
-
104
-
105
-
106
-
107
-
108
-
109
-
110
-
111
-
112
-
113
-
114
-
115
-
116
-
117
-
118
-
119
-
120
-
121
-
122
-
123
-
124
-
125
-
126
-
127
-
128
-
129
-
130
-
131
-
132
-
133
-
134
-
135
-
136
 |
 |

Table of Contents
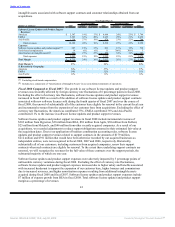
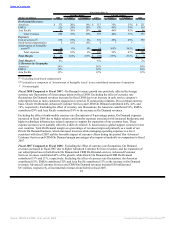
Year Ended May 31,
Percent Change Percent Change
(Dollars in millions) 2008 Actual Constant 2007 Actual Constant 2006
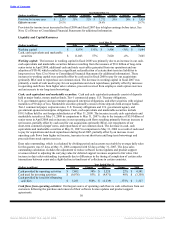
On Demand Revenues:
Americas $ 375 20% 18% $ 313 35% 35% $ 231
EMEA 226 29% 18% 176 49% 39% 118
Asia Pacific 93 36% 28% 68 46% 42% 48
Total revenues 694 25% 19% 557 40% 37% 397
Expenses:
Cost of services(1) 632 10% 6% 574 49% 45% 385
Stock-based compensation 5 16% 16% 4 * * —
Amortization of intangible
assets(2) 14 0% 0% 14 365% 365% 3
Total expenses 651 10% 6% 592 52% 47% 388
Total Margin $ 43 224% 213% $ (35) -553% -512% $ 9
Total Margin % 6% -6% 2%
% Revenues by Geography:
Americas 54% 56% 58%
EMEA 33% 32% 30%
Asia Pacific 13% 12% 12%
(1) Excluding stock-based compensation
(2) Included as a component of ‘Amortization of Intangible Assets’ in our consolidated statements of operations
* Not meaningful
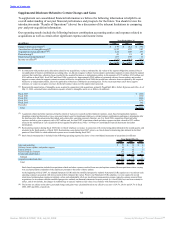
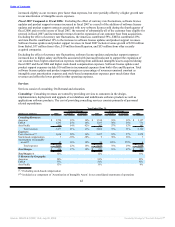
Fiscal 2008 Compared to Fiscal 2007: On Demand revenue growth was positively affected by foreign
currency rate fluctuations of 6 percentage points in fiscal 2008. Excluding the effect of currency rate
fluctuations, On Demand revenues increased in fiscal 2008 due to an increase in each service category’s
subscription base as more customers engaged us to provide IT outsourcing solutions. On a constant currency
basis, Oracle On Demand, Advanced Customer Services and CRM On Demand contributed 44%, 42% and
14%, respectively. Excluding the effect of currency rate fluctuations, the Americas contributed 53%, EMEA
contributed 29% and Asia Pacific contributed 18% to the increase in On Demand revenues.
Excluding the effect of unfavorable currency rate fluctuations of 4 percentage points, On Demand expenses
increased in fiscal 2008 due to higher salaries and benefits expenses associated with increased headcount, and
higher technology infrastructure related expenses to support the expansion of our customer base. These
expense increases were partially offset by a shift of certain U.S. based costs to global support centers in lower
cost countries. Total On Demand margin as a percentage of revenues improved primarily as a result of our
Oracle On Demand business, which increased revenues while managing operating expenses to a level
consistent with fiscal 2007 and the favorable impact of currency effects during the period. Our Advanced
Customer Services and CRM On Demand margin percentages also improved modestly in comparison to fiscal
2007.
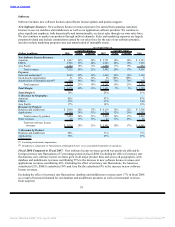
Fiscal 2007 Compared to Fiscal 2006: Excluding the effect of currency rate fluctuations, On Demand
revenues increased in fiscal 2007 due to higher Advanced Customer Services revenues, and the expansion of
our subscription base in both Oracle On Demand and CRM On Demand services. Advanced Customer
Services revenues contributed 46% of the growth, while Oracle On Demand and CRM On Demand
contributed 33% and 21%, respectively. Excluding the effect of currency rate fluctuations, the Americas
contributed 55%, EMEA contributed 32% and Asia Pacific contributed 13% to the increase in On Demand
revenues. Advanced Customer Services and CRM On Demand revenues included $50 million and
$31 million, respectively, of incremental revenues from Siebel in fiscal 2007.
44
Source: ORACLE CORP, 10-K, July 02, 2008 Powered by Morningstar® Document Research℠