Oracle 2007 Annual Report Download - page 30
Download and view the complete annual report
Please find page 30 of the 2007 Oracle annual report below. You can navigate through the pages in the report by either clicking on the pages listed below, or by using the keyword search tool below to find specific information within the annual report.-
 1
1 -
2
-
3
-
4
-
5
-
6
-
7
-
8
-
9
-
10
-
11
-
12
-
13
-
14
-
15
-
16
-
17
-
18
-
19
-
 20
20 -
 21
21 -
 22
22 -
 23
23 -
 24
24 -
 25
25 -
 26
26 -
 27
27 -
 28
28 -
 29
29 -
 30
30 -
 31
31 -
 32
32 -
 33
33 -
 34
34 -
 35
35 -
 36
36 -
 37
37 -
 38
38 -
 39
39 -
 40
40 -
41
-
42
-
43
-
44
-
45
-
46
-
47
-
48
-
49
-
50
-
51
-
52
-
53
-
54
-
55
-
56
-
57
-
58
-
59
-
60
-
61
-
62
-
63
-
64
-
65
-
66
-
67
-
68
-
69
-
70
-
71
-
72
-
73
-
74
-
75
-
76
-
77
-
78
-
79
-
80
-
81
-
82
-
83
-
84
-
85
-
86
-
87
-
88
-
89
-
90
-
91
-
92
-
93
-
94
-
95
-
96
-
97
-
98
-
99
-
100
-
101
-
102
-
103
-
104
-
105
-
106
-
107
-
108
-
109
-
110
-
111
-
112
-
113
-
114
-
115
-
116
-
117
-
118
-
119
-
120
-
121
-
122
-
123
-
124
-
125
-
126
-
127
-
128
-
129
-
130
-
131
-
132
-
133
-
134
-
135
-
136
 |
 |

Table of Contents
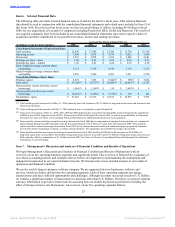
Item 6. Selected Financial Data
The following table sets forth selected financial data as of and for the last five fiscal years. This selected financial
data should be read in conjunction with the consolidated financial statements and related notes included in Item 15 of
this Form 10-K. Over the last four fiscal years, we have invested billions of dollars, including $9.4 billion in fiscal
2008, for our acquisitions of a number of companies including PeopleSoft, BEA, Siebel and Hyperion. The results of
our acquired companies have been included in our consolidated financial statements since their respective dates of
acquisition and have contributed to our growth in revenues, income and earnings per share.
As of and For The Year Ended May 31,
(in millions, except per share amounts) 2008 2007 2006 2005 2004
Consolidated Statements of Operations Data:
Total revenues $ 22,430 $ 17,996 $ 14,380 $ 11,799 $ 10,156
Operating income $ 7,844 $ 5,974 $ 4,736 $ 4,022 $ 3,864
Net income $ 5,521 $ 4,274 $ 3,381 $ 2,886 $ 2,681
Earnings per share—basic $ 1.08 $ 0.83 $ 0.65 $ 0.56 $ 0.51
Earnings per share—diluted $ 1.06 $ 0.81 $ 0.64 $ 0.55 $ 0.50
Basic weighted average common shares
outstanding 5,133 5,170 5,196 5,136 5,215
Diluted weighted average common shares
outstanding 5,229 5,269 5,287 5,231 5,326
Consolidated Balance Sheets Data:
Working capital $ 8,074 $ 3,496 $ 5,044(1) $ 385(2) $ 7,064
Total assets $ 47,268(3) $ 34,572(3) $ 29,029(3) $ 20,687(3) $ 12,763
Notes payable, current and other current
borrowings $ 1,001(4) $ 1,358(4) $ 159 $ 2,693(4) $ 9
Notes payable and other non-current
borrowings $ 10,235(5) $ 6,235(5) $ 5,735(5) $ 159 $ 163
Stockholders’ equity $ 23,025 $ 16,919 $ 15,012 $ 10,837 $ 7,995
(1) Total working capital increased as of May 31, 2006 primarily due to the issuance of $5.75 billion in long-term senior notes and increased cash
flows from operations.
(2) Total working capital decreased as of May 31, 2005 primarily due to cash paid to acquire PeopleSoft.
(3) Total assets increased as of May 31, 2008, 2007, 2006 and 2005 primarily due to goodwill and intangible assets arising from the acquisitions
of BEA in fiscal 2008, Hyperion in fiscal 2007, Siebel in fiscal 2006 and PeopleSoft in fiscal 2005, as well as our profitability in all periods
presented. See Note 2 of Notes to Consolidated Financial Statements for additional information on our acquisitions.
(4) Notes payable, current and other current borrowings decreased in fiscal 2008 due to repayments of amounts borrowed under our commercial
paper program during fiscal 2007 partially offset by the reclassification of $1.0 billion of senior notes that mature in 2009. Notes payable,
current and other current borrowings increased in fiscal 2005 due to amounts borrowed under our commercial paper program and amounts
borrowed by Oracle Technology Company, a wholly-owned subsidiary. We repaid these fiscal 2005 borrowings in fiscal 2006.
(5) Notes payable and other non-current borrowings increased between fiscal 2006 and fiscal 2008 due to the issuances of $5.0 billion of
long-term senior notes in fiscal 2008, $2.0 billion of long-term senior notes in fiscal 2007 and $5.75 billion of long-term senior notes in fiscal
2006, partially offset by redemptions of $1.5 billion in fiscal 2007. See Note 6 of Notes to Consolidated Financial Statements for additional
information on our borrowings.
Item 7. Management’s Discussion and Analysis of Financial Condition and Results of Operations
We begin Management’s Discussion and Analysis of Financial Condition and Results of Operations with an
overview of our key operating business segments and significant trends. This overview is followed by a summary of
our critical accounting policies and estimates that we believe are important to understanding the assumptions and
judgments incorporated in our reported financial results. We then provide a more detailed analysis of our results of
operations and financial condition.
We are the world’s largest enterprise software company. We are organized into two businesses, software and
services, which are further divided into five operating segments. Each of these operating segments has unique
characteristics and faces different opportunities and challenges. Although we report our actual results in U.S. Dollars,
we conduct a significant number of transactions in currencies other than U.S. Dollars. Therefore, we present constant
currency information to provide a framework for assessing how our underlying business performed excluding the
effect of foreign currency rate fluctuations. An overview of our five operating segments follows.
25
Source: ORACLE CORP, 10-K, July 02, 2008 Powered by Morningstar® Document Research℠