Oracle 2007 Annual Report Download - page 28
Download and view the complete annual report
Please find page 28 of the 2007 Oracle annual report below. You can navigate through the pages in the report by either clicking on the pages listed below, or by using the keyword search tool below to find specific information within the annual report.-
 1
1 -
2
-
3
-
4
-
5
-
6
-
7
-
8
-
9
-
10
-
11
-
12
-
13
-
14
-
15
-
16
-
17
-
 18
18 -
 19
19 -
 20
20 -
 21
21 -
 22
22 -
 23
23 -
 24
24 -
 25
25 -
 26
26 -
 27
27 -
 28
28 -
 29
29 -
 30
30 -
 31
31 -
 32
32 -
 33
33 -
 34
34 -
 35
35 -
 36
36 -
 37
37 -
 38
38 -
39
-
40
-
41
-
42
-
43
-
44
-
45
-
46
-
47
-
48
-
49
-
50
-
51
-
52
-
53
-
54
-
55
-
56
-
57
-
58
-
59
-
60
-
61
-
62
-
63
-
64
-
65
-
66
-
67
-
68
-
69
-
70
-
71
-
72
-
73
-
74
-
75
-
76
-
77
-
78
-
79
-
80
-
81
-
82
-
83
-
84
-
85
-
86
-
87
-
88
-
89
-
90
-
91
-
92
-
93
-
94
-
95
-
96
-
97
-
98
-
99
-
100
-
101
-
102
-
103
-
104
-
105
-
106
-
107
-
108
-
109
-
110
-
111
-
112
-
113
-
114
-
115
-
116
-
117
-
118
-
119
-
120
-
121
-
122
-
123
-
124
-
125
-
126
-
127
-
128
-
129
-
130
-
131
-
132
-
133
-
134
-
135
-
136
 |
 |

Table of Contents
PART II
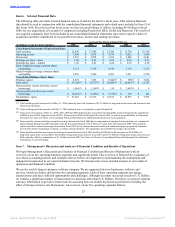
Item 5. Market for Registrant’s Common Equity, Related Stockholder Matters and Issuer Purchases
of Equity Securities
Our common stock is traded on the NASDAQ Global Select Market under the symbol “ORCL” and has been
traded on NASDAQ since our initial public offering in 1986. According to the records of our transfer agent,
we had 20,505 stockholders of record as of May 31, 2008. The following table sets forth the low and high sale
price of our common stock, based on the last daily sale, in each of our last eight fiscal quarters.
Fiscal 2008 Fiscal 2007
Low Sale High Sale Low Sale High Sale
Price Price Price Price
Fourth Quarter $ 18.44 $ 22.84 $ 16.37 $ 19.42
Third Quarter $ 18.80 $ 23.11 $ 16.29 $ 19.28
Second Quarter $ 19.36 $ 22.92 $ 15.50 $ 19.66
First Quarter $ 18.73 $ 20.78 $ 13.15 $ 15.81
Our policy has been to reinvest earnings to fund future growth, acquisitions and to repurchase our common
stock pursuant to a program approved by our Board of Directors. Accordingly, we have not paid cash
dividends and do not anticipate declaring cash dividends on our common stock in the foreseeable future,
although our Board of Directors reviews this matter from time to time.
For equity compensation plan information, please refer to Item 12 in Part III of this Annual Report.
Stock Repurchase Programs
Our Board of Directors has approved a program to repurchase shares of our common stock to reduce the
dilutive effect of our stock option and stock purchase plans. In April 2007, our Board of Directors expanded
our repurchase program by $4.0 billion and, as of May 31, 2008, $2.2 billion was available for share
repurchases pursuant to our stock repurchase program.
Our stock repurchase authorization does not have an expiration date and the pace of our repurchase activity
will depend on factors such as our working capital needs, our cash requirements for acquisitions, our debt
repayment obligations, our stock price, and economic and market conditions. Our stock repurchases may be
effected from time to time through open market purchases or pursuant to a Rule 10b5-1 plan. Our stock
repurchase program may be accelerated, suspended, delayed or discontinued at any time.
The following table summarizes the stock repurchase activity for the three months ending May 31, 2008 and
the approximate dollar value of shares that may yet be purchased pursuant to our share repurchase programs:
Total Number of Approximate Dollar
Total Number Average Shares Purchased as Value of Shares that
of Shares Price Paid Part of Publicly May Yet Be Purchased
(in millions, except per share amounts) Purchased per Share Announced Programs Under the Programs
March 1, 2008—March 31, 2008 8.1 $ 19.63 8.1 $ 2,550.8
April 1, 2008—April 30, 2008 8.4 $ 20.87 8.4 $ 2,376.1
May 1, 2008—May 31, 2008 7.6 $ 21.89 7.6 $ 2,209.4
Total 24.1 $ 20.76 24.1
23
Source: ORACLE CORP, 10-K, July 02, 2008 Powered by Morningstar® Document Research℠