Oracle 2007 Annual Report Download - page 113
Download and view the complete annual report
Please find page 113 of the 2007 Oracle annual report below. You can navigate through the pages in the report by either clicking on the pages listed below, or by using the keyword search tool below to find specific information within the annual report.-
 1
1 -
2
-
3
-
4
-
5
-
6
-
7
-
8
-
9
-
10
-
11
-
12
-
13
-
14
-
15
-
16
-
17
-
18
-
19
-
20
-
21
-
22
-
23
-
24
-
25
-
26
-
27
-
28
-
29
-
30
-
31
-
32
-
33
-
34
-
35
-
36
-
37
-
38
-
39
-
40
-
41
-
42
-
43
-
44
-
45
-
46
-
47
-
48
-
49
-
50
-
51
-
52
-
53
-
54
-
55
-
56
-
57
-
58
-
59
-
60
-
61
-
62
-
63
-
64
-
65
-
66
-
67
-
68
-
69
-
70
-
71
-
72
-
73
-
74
-
75
-
76
-
77
-
78
-
79
-
80
-
81
-
82
-
83
-
84
-
85
-
86
-
87
-
88
-
89
-
90
-
91
-
92
-
93
-
94
-
95
-
96
-
97
-
98
-
99
-
100
-
101
-
102
-
 103
103 -
 104
104 -
 105
105 -
 106
106 -
 107
107 -
 108
108 -
 109
109 -
 110
110 -
 111
111 -
 112
112 -
 113
113 -
 114
114 -
 115
115 -
 116
116 -
 117
117 -
 118
118 -
 119
119 -
 120
120 -
 121
121 -
 122
122 -
 123
123 -
124
-
125
-
126
-
127
-
128
-
129
-
130
-
131
-
132
-
133
-
134
-
135
-
136
 |
 |

Table of Contents
ORACLE CORPORATION
NOTES TO CONSOLIDATED FINANCIAL STATEMENTS—(Continued)
May 31, 2008
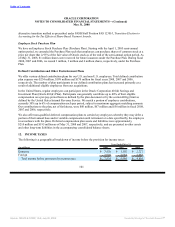
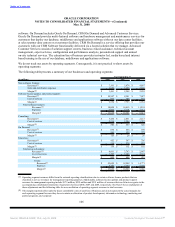
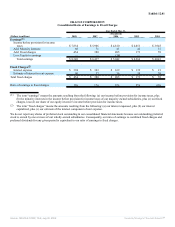
Geographic Information
Disclosed in the table below is geographic information for each country that comprised greater than three
percent of our total revenues for fiscal 2008, fiscal 2007 or fiscal 2006.
Year Ended May 31,
2008 2007 2006
Long Lived Long Lived Long Lived
(in millions) Revenues Assets(1) Revenues Assets(1) Revenues Assets(1)
United States $ 9,650 $ 1,465 $ 7,826 $ 1,404 $ 6,449 $ 1,351
United Kingdom 1,655 110 1,293 111 1,153 109
Japan 1,068 207 909 164 841 105
Germany 983 9 720 11 579 8
France 858 21 635 16 509 16
Canada 737 15 548 10 472 12
Other foreign
countries 7,479 532 6,065 415 4,377 179
Total $ 22,430 $ 2,359 $ 17,996 $ 2,131 $ 14,380 $ 1,780
(1) Long-lived assets exclude goodwill, intangible assets, equity investments and deferred taxes, which are not allocated
to specific geographic locations as it is impracticable to do so.
14. EARNINGS PER SHARE
Basic earnings per share is computed by dividing net income for the period by the weighted average number
of common shares outstanding during the period. Diluted earnings per share is computed by dividing net
income for the period by the weighted average number of common shares outstanding during the period, plus
the dilutive effect of outstanding stock awards and shares issuable under the employee stock purchase plan
using the treasury stock method. The following table sets forth the computation of basic and diluted earnings
per share:
Year Ended May 31,
(in millions, except per share data) 2008 2007 2006
Net income $ 5,521 $ 4,274 $ 3,381
Weighted average common shares outstanding 5,133 5,170 5,196
Dilutive effect of employee stock plans 96 99 91
Dilutive weighted average common shares outstanding 5,229 5,269 5,287
Basic earnings per share $ 1.08 $ 0.83 $ 0.65
Diluted earnings per share $ 1.06 $ 0.81 $ 0.64
Shares subject to anti-dilutive stock options excluded from
calculation(1) 98 76 123
(1) These weighted shares relate to anti-dilutive stock options as calculated using the treasury stock method (described
above) and could be dilutive in the future. See Note 11 for information regarding the prices of our outstanding,
unexercised options.
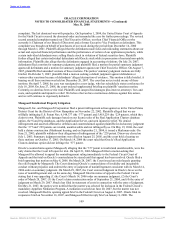
15. LEGAL PROCEEDINGS
Securities Class Action
Stockholder class actions were filed in the United States District Court for the Northern District of California
against us and our Chief Executive Officer on and after March 9, 2001. Between March 2002 and March
2003, the court dismissed plaintiffs’ consolidated complaint, first amended complaint and a revised second
amended
108
Source: ORACLE CORP, 10-K, July 02, 2008 Powered by Morningstar® Document Research℠