Oracle 2007 Annual Report Download - page 47
Download and view the complete annual report
Please find page 47 of the 2007 Oracle annual report below. You can navigate through the pages in the report by either clicking on the pages listed below, or by using the keyword search tool below to find specific information within the annual report.-
 1
1 -
2
-
3
-
4
-
5
-
6
-
7
-
8
-
9
-
10
-
11
-
12
-
13
-
14
-
15
-
16
-
17
-
18
-
19
-
20
-
21
-
22
-
23
-
24
-
25
-
26
-
27
-
28
-
29
-
30
-
31
-
32
-
33
-
34
-
35
-
36
-
 37
37 -
 38
38 -
 39
39 -
 40
40 -
 41
41 -
 42
42 -
 43
43 -
 44
44 -
 45
45 -
 46
46 -
 47
47 -
 48
48 -
 49
49 -
 50
50 -
 51
51 -
 52
52 -
 53
53 -
 54
54 -
 55
55 -
 56
56 -
 57
57 -
58
-
59
-
60
-
61
-
62
-
63
-
64
-
65
-
66
-
67
-
68
-
69
-
70
-
71
-
72
-
73
-
74
-
75
-
76
-
77
-
78
-
79
-
80
-
81
-
82
-
83
-
84
-
85
-
86
-
87
-
88
-
89
-
90
-
91
-
92
-
93
-
94
-
95
-
96
-
97
-
98
-
99
-
100
-
101
-
102
-
103
-
104
-
105
-
106
-
107
-
108
-
109
-
110
-
111
-
112
-
113
-
114
-
115
-
116
-
117
-
118
-
119
-
120
-
121
-
122
-
123
-
124
-
125
-
126
-
127
-
128
-
129
-
130
-
131
-
132
-
133
-
134
-
135
-
136
 |
 |

Table of Contents
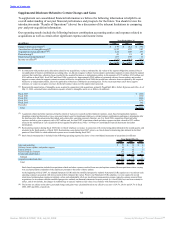
increased slightly as our revenues grew faster than expenses, but were partially offset by a higher growth rate
in our amortization of intangible assets expenses.
Fiscal 2007 Compared to Fiscal 2006: Excluding the effect of currency rate fluctuations, software license
updates and product support revenues increased in fiscal 2007 as a result of the addition of software license
updates and product support contracts associated with new software licenses sold during the fourth quarter of
fiscal 2006 and over the course of fiscal 2007, the renewal of substantially all of the customer base eligible for
renewal in fiscal 2007 and incremental revenues from the expansion of our customer base from acquisitions.
Excluding the effect of currency rate fluctuations, the Americas contributed 59%, EMEA contributed 29%
and Asia Pacific contributed 12% to the increase in software license updates and product support revenues.
Software license updates and product support revenues in fiscal 2007 include revenue growth of $310 million
from Siebel, $37 million from i-flex, $19 million from Hyperion, and $55 million from other recently
acquired companies.
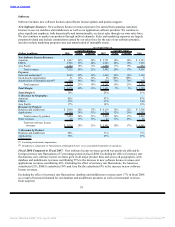
Excluding the effect of currency rate fluctuations, software license updates and product support expenses
increased due to higher salary and benefits associated with increased headcount to support the expansion of
our customer base, higher amortization expenses resulting from additional intangible assets acquired during
fiscal 2007 and fiscal 2006 and higher stock-based compensation expenses. Software license updates and
product support expenses include $16 million in incremental expenses from both i-flex and Hyperion. Total
software license updates and product support margin as a percentage of revenues remained constant as
intangible asset amortization expenses and stock-based compensation expenses grew much faster than
revenues and offset the lower growth in other operating expenses.
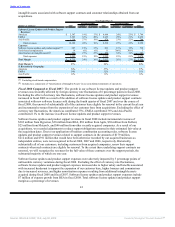
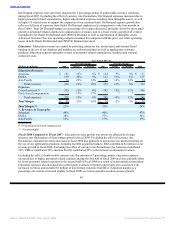
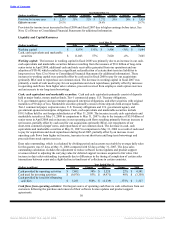
Services
Services consist of consulting, On Demand and education.
Consulting: Consulting revenues are earned by providing services to customers in the design,
implementation, deployment and upgrade of our database and middleware software products as well as
applications software products. The cost of providing consulting services consists primarily of personnel
related expenditures.
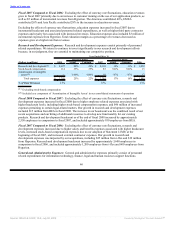
Year Ended May 31,
Percent Change Percent Change
(Dollars in millions) 2008 Actual Constant 2007 Actual Constant 2006
Consulting Revenues:
Americas $ 1,720 12% 10% $ 1,534 33% 32% $ 1,157
EMEA 1,291 25% 14% 1,033 34% 24% 771
Asia Pacific 466 54% 42% 302 57% 52% 192
Total revenues 3,477 21% 15% 2,869 35% 31% 2,120
Expenses:
Cost of services(1) 3,014 22% 16% 2,477 32% 27% 1,878
Stock-based compensation 7 -18% -18% 9 36% 36% 7
Amortization of intangible
assets(2) 42 38% 38% 30 585% 579% 4
Total expenses 3,063 22% 16% 2,516 33% 29% 1,889
Total Margin $ 414 17% 10% $ 353 53% 47% $ 231
Total Margin % 12% 12% 11%
% Revenues by Geography:
Americas 50% 53% 55%
EMEA 37% 36% 36%
Asia Pacific 13% 11% 9%
(1) Excluding stock-based compensation
(2) Included as a component of ’Amortization of Intangible Assets’ in our consolidated statements of operations
42
Source: ORACLE CORP, 10-K, July 02, 2008 Powered by Morningstar® Document Research℠