Oracle 2007 Annual Report Download - page 61
Download and view the complete annual report
Please find page 61 of the 2007 Oracle annual report below. You can navigate through the pages in the report by either clicking on the pages listed below, or by using the keyword search tool below to find specific information within the annual report.-
 1
1 -
2
-
3
-
4
-
5
-
6
-
7
-
8
-
9
-
10
-
11
-
12
-
13
-
14
-
15
-
16
-
17
-
18
-
19
-
20
-
21
-
22
-
23
-
24
-
25
-
26
-
27
-
28
-
29
-
30
-
31
-
32
-
33
-
34
-
35
-
36
-
37
-
38
-
39
-
40
-
41
-
42
-
43
-
44
-
45
-
46
-
47
-
48
-
49
-
50
-
 51
51 -
 52
52 -
 53
53 -
 54
54 -
 55
55 -
 56
56 -
 57
57 -
 58
58 -
 59
59 -
 60
60 -
 61
61 -
 62
62 -
 63
63 -
 64
64 -
 65
65 -
 66
66 -
 67
67 -
 68
68 -
 69
69 -
 70
70 -
 71
71 -
72
-
73
-
74
-
75
-
76
-
77
-
78
-
79
-
80
-
81
-
82
-
83
-
84
-
85
-
86
-
87
-
88
-
89
-
90
-
91
-
92
-
93
-
94
-
95
-
96
-
97
-
98
-
99
-
100
-
101
-
102
-
103
-
104
-
105
-
106
-
107
-
108
-
109
-
110
-
111
-
112
-
113
-
114
-
115
-
116
-
117
-
118
-
119
-
120
-
121
-
122
-
123
-
124
-
125
-
126
-
127
-
128
-
129
-
130
-
131
-
132
-
133
-
134
-
135
-
136
 |
 |

Table of Contents
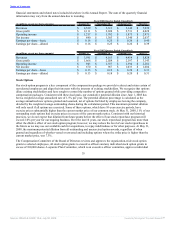
stock option grants up to 100,000 shares to non-executive officers and employees. Stock option activity from
June 1, 2005 through May 31, 2008 is summarized as follows (shares in millions):
Options outstanding at May 31, 2005 469
Options granted 190
Options assumed 143
Options exercised (328)
Forfeitures and cancellations (96)
Options outstanding at May 31, 2008 378
Average annualized options granted and assumed net of forfeitures 79
Average annualized stock repurchases 159
Shares outstanding at May 31, 2008 5,150
Weighted average shares outstanding from June 1, 2005 through May 31, 2008 5,166
Options outstanding as a percent of shares outstanding at May 31, 2008 7.3%
In the money options outstanding (based on our May 31, 2008 stock price) as a percent of shares
outstanding at May 31, 2008 6.6%
Weighted average annualized options granted and assumed, net of forfeitures and before stock
repurchases, as a percent of weighted average shares outstanding from June 1, 2005 through
May 31, 2008 1.5%
Weighted average annualized options granted and assumed, net of forfeitures and after stock
repurchases, as a percent of weighted average shares outstanding from June 1, 2005 through
May 31, 2008 -1.6%
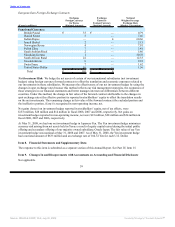
Our Compensation Committee approves the annual organization-wide option grants to certain key employees.
These annual option grants are made during the ten business day period following the second trading day after
the announcement of our fiscal fourth quarter earnings report.
Recent Accounting Pronouncements
For information with respect to recent accounting pronouncements and the impact of these pronouncements
on our consolidated financial statements, see Note 1 of Notes to Consolidated Financial Statements.
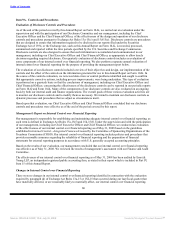
Item 7A. Quantitative and Qualitative Disclosures About Market Risk
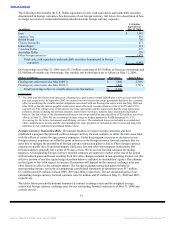
Interest Rate Risk: We generally purchase debt security investments with relatively short maturities (see a
description of our debt securities held in the Liquidity and Capital Resources section of Management’s
Discussion and Analysis of Financial Condition and Results of Operations presented above). Therefore,
interest rate movements generally do not materially affect the valuation of our debt security investments.
Changes in the overall level of interest rates affect the interest income that is generated from our investments.
For fiscal 2008, total interest income was $337 million with investments yielding an average 3.44% on a
worldwide basis. This interest rate level was down by 53 basis points from 3.97% for fiscal 2007. If overall
interest rates fell by 100 basis points from our average of 3.44% during fiscal 2008, our annual interest
income would decline by approximately $95 million, assuming consistent investment levels. The table below
presents the cash, cash equivalent and marketable securities balances and the related weighted average
interest rates for our investment portfolio at May 31, 2008. The cash, cash equivalent and marketable
securities balances are recorded at their fair values at May 31, 2008.
Fair Value of
Available-for-Sale Weighted Average
(Dollars in millions) Securities Interest Rate
Cash and cash equivalents $ 8,262 2.35%
Marketable securities 2,781 2.71%
Total cash, cash equivalents and marketable securities $ 11,043 2.44%
56
Source: ORACLE CORP, 10-K, July 02, 2008 Powered by Morningstar® Document Research℠