Oracle 2007 Annual Report Download - page 44
Download and view the complete annual report
Please find page 44 of the 2007 Oracle annual report below. You can navigate through the pages in the report by either clicking on the pages listed below, or by using the keyword search tool below to find specific information within the annual report.-
 1
1 -
2
-
3
-
4
-
5
-
6
-
7
-
8
-
9
-
10
-
11
-
12
-
13
-
14
-
15
-
16
-
17
-
18
-
19
-
20
-
21
-
22
-
23
-
24
-
25
-
26
-
27
-
28
-
29
-
30
-
31
-
32
-
33
-
 34
34 -
 35
35 -
 36
36 -
 37
37 -
 38
38 -
 39
39 -
 40
40 -
 41
41 -
 42
42 -
 43
43 -
 44
44 -
 45
45 -
 46
46 -
 47
47 -
 48
48 -
 49
49 -
 50
50 -
 51
51 -
 52
52 -
 53
53 -
 54
54 -
55
-
56
-
57
-
58
-
59
-
60
-
61
-
62
-
63
-
64
-
65
-
66
-
67
-
68
-
69
-
70
-
71
-
72
-
73
-
74
-
75
-
76
-
77
-
78
-
79
-
80
-
81
-
82
-
83
-
84
-
85
-
86
-
87
-
88
-
89
-
90
-
91
-
92
-
93
-
94
-
95
-
96
-
97
-
98
-
99
-
100
-
101
-
102
-
103
-
104
-
105
-
106
-
107
-
108
-
109
-
110
-
111
-
112
-
113
-
114
-
115
-
116
-
117
-
118
-
119
-
120
-
121
-
122
-
123
-
124
-
125
-
126
-
127
-
128
-
129
-
130
-
131
-
132
-
133
-
134
-
135
-
136
 |
 |
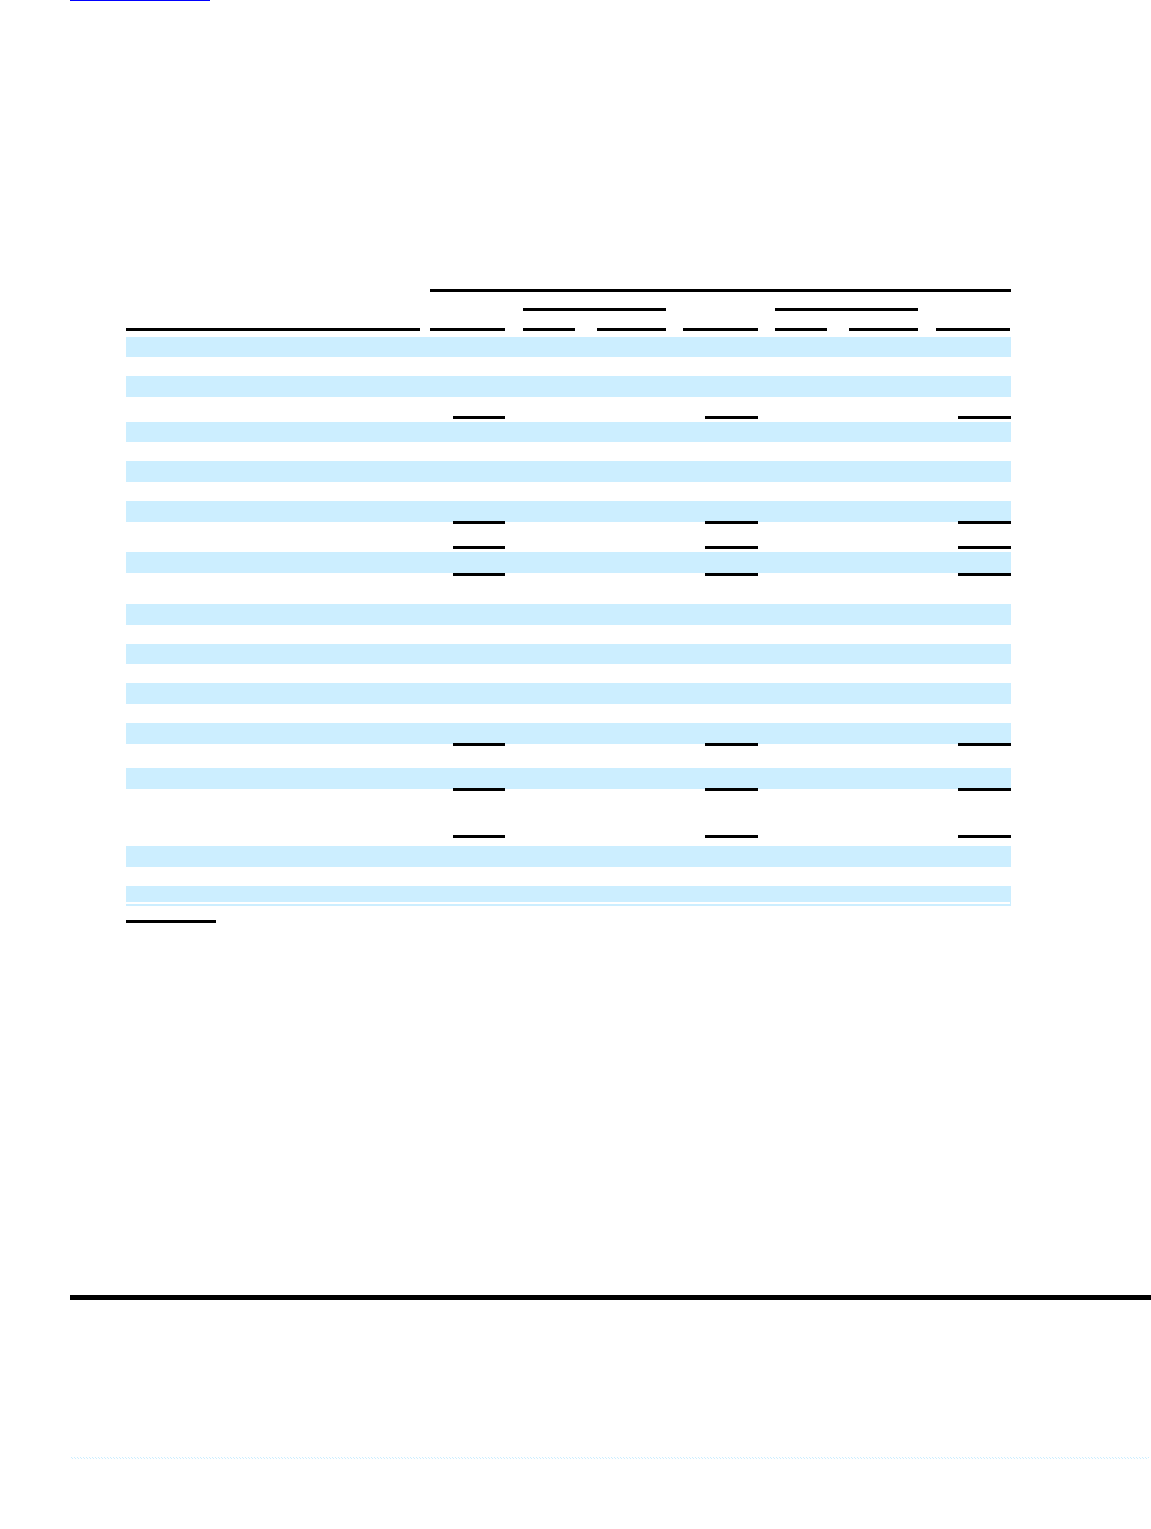
Table of Contents
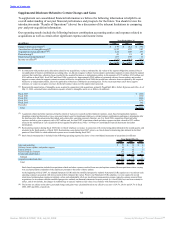
Software
Software includes new software licenses and software license updates and product support.
New Software Licenses: New software license revenues represent fees earned from granting customers
licenses to use our database and middleware as well as our application software products. We continue to
place significant emphasis, both domestically and internationally, on direct sales through our own sales force.
We also continue to market our products through indirect channels. Sales and marketing expenses are largely
personnel-related and include commissions earned by our sales force for the sale of our software products,
and also include marketing program costs and amortization of intangible assets.
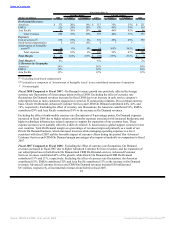
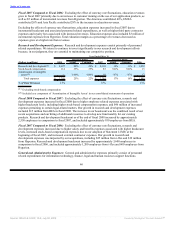
Year Ended May 31,
Percent Change Percent Change
(Dollars in millions) 2008 Actual Constant 2007 Actual Constant 2006
New Software License Revenues:
Americas $ 3,467 26% 24% $ 2,751 18% 18% $ 2,323
EMEA 2,766 35% 24% 2,043 24% 16% 1,650
Asia Pacific 1,282 18% 11% 1,088 17% 15% 932
Total revenues 7,515 28% 21% 5,882 20% 17% 4,905
Expenses:
Sales and marketing(1) 4,628 20% 14% 3,869 22% 18% 3,169
Stock-based compensation 51 32% 32% 38 388% 388% 8
Amortization of intangible assets(2) 560 58% 58% 354 70% 70% 208
Total expenses 5,239 23% 18% 4,261 26% 23% 3,385
Total Margin $ 2,276 40% 31% $ 1,621 7% 3% $ 1,520
Total Margin % 30% 28% 31%
% Revenues by Geography:
Americas 46% 47% 47%
EMEA 37% 35% 34%
Asia Pacific 17% 18% 19%
Revenues by Product:
Database and middleware $ 5,090 24% 17% $ 4,119 15% 12% $ 3,566
Applications 2,369 38% 33% 1,716 32% 29% 1,303
Total revenues by product 7,459 28% 21% 5,835 20% 17% 4,869
Other revenues 56 19% 15% 47 31% 29% 36
Total new software license
revenues $ 7,515 28% 21% $ 5,882 20% 17% $ 4,905
% Revenues by Product:
Database and middleware 68% 71% 73%
Applications 32% 29% 27%
(1) Excluding stock-based compensation
(2) Included as a component of ‘Amortization of Intangible Assets’ in our consolidated statements of operations
Fiscal 2008 Compared to Fiscal 2007: New software license revenues growth was positively affected by
foreign currency rate fluctuations of 7 percentage points in fiscal 2008. Excluding the effect of currency rate
fluctuations, new software license revenues grew in all major product lines and across all geographies, with
database and middleware revenues contributing 55% to the increase in new software license revenues and
applications revenues contributing 45%. Excluding the effect of currency rate fluctuations, the Americas
contributed 52%, EMEA contributed 39% and Asia Pacific contributed 9% to the increase in new software
license revenues.
Excluding the effect of currency rate fluctuations, database and middleware revenues grew 17% in fiscal 2008
as a result of increased demand for our database and middleware products as well as incremental revenues
from acquired
39
Source: ORACLE CORP, 10-K, July 02, 2008 Powered by Morningstar® Document Research℠