LensCrafters 2008 Annual Report Download - page 95
Download and view the complete annual report
Please find page 95 of the 2008 LensCrafters annual report below. You can navigate through the pages in the report by either clicking on the pages listed below, or by using the keyword search tool below to find specific information within the annual report.-
 1
1 -
2
-
3
-
4
-
5
-
6
-
7
-
8
-
9
-
10
-
11
-
12
-
13
-
14
-
15
-
16
-
17
-
18
-
19
-
20
-
21
-
22
-
23
-
24
-
25
-
26
-
27
-
28
-
29
-
30
-
31
-
32
-
33
-
34
-
35
-
36
-
37
-
38
-
39
-
40
-
41
-
42
-
43
-
44
-
45
-
46
-
47
-
48
-
49
-
50
-
51
-
52
-
53
-
54
-
55
-
56
-
57
-
58
-
59
-
60
-
61
-
62
-
63
-
64
-
65
-
66
-
67
-
68
-
69
-
70
-
71
-
72
-
73
-
74
-
75
-
76
-
77
-
78
-
79
-
80
-
81
-
82
-
83
-
84
-
 85
85 -
 86
86 -
 87
87 -
 88
88 -
 89
89 -
 90
90 -
 91
91 -
 92
92 -
 93
93 -
 94
94 -
 95
95 -
 96
96 -
 97
97 -
 98
98 -
 99
99 -
 100
100 -
 101
101 -
 102
102 -
 103
103 -
 104
104 -
 105
105 -
106
-
107
-
108
-
109
-
110
-
111
-
112
-
113
-
114
-
115
-
116
-
117
-
118
-
119
-
120
 |
 |
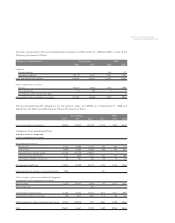
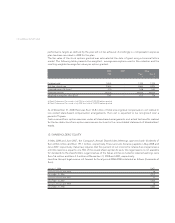
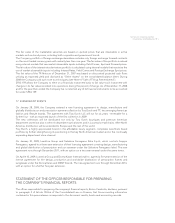
(5) No single customer represents five percent or more of sales in any year presented.
(6) Sales, income from operations and identifiable assets are the result of combination of legal entities located in the same geographic area.
14. FINANCIAL INSTRUMENTS
Concentration of Credit Risk. Financial instruments which potentially expose the Company to
concentration of credit risk consist primarily of cash investments and accounts receivable. The Company
attempts to limit its credit risk associated with cash equivalents by placing the Company’s cash balances
and investments with highly rated banks and financial institutions. With respect to accounts receivable,
the Company limits its credit risk by performing ongoing credit evaluations and certain customers may be
required to post security in the form of letters of credit. As of December 31, 2008 and 2007, no single
customer balances comprised 10 percent or more of the overall accounts receivable balance. However,
included in accounts receivable as of December 31, 2008 and 2007, was approximately Euro 12.3 million
for both fiscal years, due from the host stores of our license brands retail division. These receivables
represent cash proceeds from sales deposited into the host stores bank accounts, which are subsequently
forwarded to the Company on a weekly or monthly basis depending on the Company’s contract with the
particular host store and are based on contract arrangements that are short-term in length.
Concentration of Supplier Risk. As a result of the OPSM and Cole acquisitions, Essilor S.A. has become
one of the largest suppliers to the Company’s Retail Division. For the 2008, 2007 and 2006 fiscal years,
Essilor S.A. accounted for approximately 12.0 percent, 15.0 percent and 15.0 percent of the Company’s
total merchandise purchases, respectively. The Company has not signed any specific purchase contract
with Essilor. Management believes that the loss of this vendor would not have a significant impact on the
future operations of the Company as it could replace this vendor quickly with other third-party suppliers.
NOTES TO CONSOLIDATED
FINANCIAL STATEMENTS |93 <
(Thousands of Euro) Italy (6) United States (6) Asia Pacific (6) Other (6) Adjustments Consolidated
Year ended December 31, and Canada and eliminations
2006
Net sales (5) 1,321,887 3,076,503 603,640 761,955 (1,087,829) 4,676,156
Income from operations 389,275 331,002 33,841 79,397 (77,528) 755,987
Long lived assets, net 280,692 387,861 110,099 8,549 - 787,201
Identifiable assets 1,331,719 2,675,833 748,305 388,825 (175,804) 4,968,878
2007
Net sales (5) 1,506,077 3,073,086 685,561 1,114,429 (1,413,098) 4,966,054
Income from operations 377,799 324,167 57,191 127,761 (53,605) 833,313
Long lived assets, net 326,978 575,566 134,435 20,803 1,057,782
Identifiable assets 1,894,546 4,839,680 804,786 752,818 (1,134,565) 7,157,266
2008
Net sales (5) 1,379,599 3,376,294 729,050 1,307,631 (1,590,963) 5,201,611
Income from operations 290,697 332,564 53,262 133,018 (59,778) 749,763
Long lived assets, net 348,016 655,393 141,339 25,950 1,170,698
Identifiable assets 1,731,022 4,914,282 790,691 858,380 (989,150) 7,305,225