LensCrafters 2008 Annual Report Download - page 106
Download and view the complete annual report
Please find page 106 of the 2008 LensCrafters annual report below. You can navigate through the pages in the report by either clicking on the pages listed below, or by using the keyword search tool below to find specific information within the annual report.
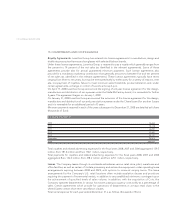
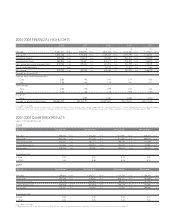
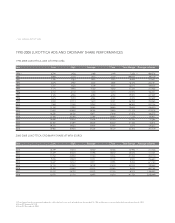
In accordance to US GAAP
(1) 1 ADS = 1 ordinary share. (2) Figures include results of Cole National operations from the acquisition date (October 4. 2004). (3) Results of Things Remembered, Inc., a former subsidiary that was sold in September 2006, are
reclassified as discontinued operations and are not included in results from continuing operations for 2006, 2005 and 2004. (4) Figures include results of Oakley operations from the acquisition date (November 14, 2007).
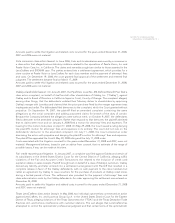
In accordance to US GAAP
(1) Except for per share (ADS) data, which is in Euro and US$. (2) All amounts in US$ were translated at the average Euro/US$ exchange rate for the period in reference. See page 110.
2004-2008 FINANCIAL HIGHLIGHTS
2008
(Euro 000) (1) (3) 1st quarter 2nd quarter 3rd quarter 4th quarter
Net sales 1,398,703 100.0% 1,354,442 100.0% 1,211,991 100.0% 1,236,476 100.0%
Gross profit 927,793 66.3% 917,034 67.7% 811,860 67.0% 800,018 64.7%
Operating income 207,057 14.8% 230,177 17.0% 195,081 16.1% 117,448 9.5%
Income before taxes 170,468 12.2% 206,581 15.3% 161,021 13.3% 51,800 4.2%
Net income 103,705 7.4% 132,580 9.8% 104,612 8.6% 38,825 3.1%
Earnings per share:
In Euro 0.23 0.29 0.23 0.09
In US$ (2) 0.34 0.46 0.35 0.11
2007-2008 QUARTERLY RESULTS
(subject to limited auditing review)
2007
(Euro 000) 2008 2007 2006 2005 2004
(4) (3) (3) (2)(3)
Net sales 5,201,611 100.0% 4,966,054 100.0% 4,676,156 100.0% 4,134,263 100.0% 3,179,613 100.0%
Gross profit 3,456,705 66.5% 3,390,436 68.3% 3,188,456 68.2% 2,761,190 66.8% 2,126,527 66.9%
Operating income 749,763 14.4% 833,313 16.8% 755,987 16.2% 581,401 14.1% 479,499 15.1%
Income before taxes 589,870 11.3% 780,681 15.7% 678,177 14.5% 539,309 13.0% 444,575 14.0%
Net income from continuing operations 379,722 7.3% 492,204 9.9% 430,705 9.2% 330,790 8.0% 279,109 8.8%
Discontinued operations - 0,0% - 0.0% (6,419) -0.1% 11,504 0.3% 7,765 0.2%
Net income 379,722 7.6% 492,204 9.9% 424,286 9.1% 342,294 8.3% 286,874 9.0%
Per ordinary share/(ADS)(1)
Earnings from continuing operations:
Euro 0.83 1.08 0.95 0.73 0.62
US$ 1.22 1.48 1.19 0.91 0.77
Total earnings
Euro 0.83 1.08 0.94 0.76 0.64
US$ 1.22 1.48 1.18 0.95 0.80
Dividend (2)
Euro -0.490 0.420 0.290 0.230
Average no. of outstanding shares 456,563,502 455,184,797 452,897,854 450,179,073 448,275,028
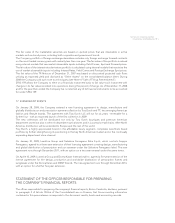
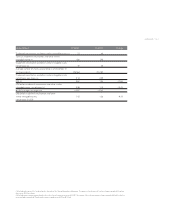
(Euro 000) (1) (3) 1st quarter 2nd quarter 3rd quarter 4th quarter
Net sales 1,299,825 100.0% 1,326,777 100.0% 1,150,952 100.0% 1,188,500 100.0%
Gross profit 874,026 67.2% 918,620 69.2% 806,101 70.0% 791,689 66.6%
Operating income 224,125 17.2% 262,486 19.8% 195,021 16.9% 151,681 12.8%
Income before taxes 208,918 16.1% 247,953 18.7% 180,315 15.7% 143,496 12.1%
Net income 128,257 9.9% 154,581 11.7% 112,441 9.8% 96,926 8.2%
Earnings per share:
In Euro 0.28 0.34 0.25 0.21
In US$ (2) 0.35 0.45 0.34 0.31


