LensCrafters 2008 Annual Report Download - page 94
Download and view the complete annual report
Please find page 94 of the 2008 LensCrafters annual report below. You can navigate through the pages in the report by either clicking on the pages listed below, or by using the keyword search tool below to find specific information within the annual report.-
 1
1 -
2
-
3
-
4
-
5
-
6
-
7
-
8
-
9
-
10
-
11
-
12
-
13
-
14
-
15
-
16
-
17
-
18
-
19
-
20
-
21
-
22
-
23
-
24
-
25
-
26
-
27
-
28
-
29
-
30
-
31
-
32
-
33
-
34
-
35
-
36
-
37
-
38
-
39
-
40
-
41
-
42
-
43
-
44
-
45
-
46
-
47
-
48
-
49
-
50
-
51
-
52
-
53
-
54
-
55
-
56
-
57
-
58
-
59
-
60
-
61
-
62
-
63
-
64
-
65
-
66
-
67
-
68
-
69
-
70
-
71
-
72
-
73
-
74
-
75
-
76
-
77
-
78
-
79
-
80
-
81
-
82
-
83
-
 84
84 -
 85
85 -
 86
86 -
 87
87 -
 88
88 -
 89
89 -
 90
90 -
 91
91 -
 92
92 -
 93
93 -
 94
94 -
 95
95 -
 96
96 -
 97
97 -
 98
98 -
 99
99 -
 100
100 -
 101
101 -
 102
102 -
 103
103 -
 104
104 -
105
-
106
-
107
-
108
-
109
-
110
-
111
-
112
-
113
-
114
-
115
-
116
-
117
-
118
-
119
-
120
 |
 |

> 92 |ANNUAL REPORT 2008
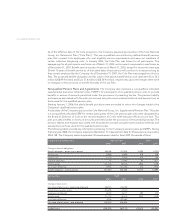
(1) Inter-segment elimination of net sales relates to intercompany sales from the manufacturing and wholesale segment to the retail segment.
(2) Inter-segment elimination of Income from operations mainly relates to depreciation and amortization of corporate identifiable assets and profit-in-stock
elimination for frames manufactured by the wholesale Segment and included in the retail segment inventory.
(3) Corporate adjustments to depreciation and amortization relate to depreciation and amortization of corporate assets.
(4) Corporate adjustments to identifiable assets include mainly the net value of goodwill and trade names of acquired retail businesses.
The geographic segments include Italy, the main manufacturing and distribution base, United States and
Canada (which includes the United States of America, Canada and Caribbean islands), Asia Pacific (which
includes Australia, New Zealand, China, Hong Kong and Japan) and Other (which includes all other
geographic locations including Europe (excluding Italy), South and Central America and the Middle East).
Sales are attributed to geographic segments based on the legal entity domicile where the sale is
originated.
(thousands of Euro) Manufacturing Retail Oakley Inter-segments Consolidated
and Wholesale transactions
and corporate
adjustments
Year ended
December 31, 2006
Net sales 1,715,369 3,294,161 (333,374) (1) 4,676,156
Income from operations 445,843 431,547 (121,403) (2) 755,987
Capital expenditure 108,117 164,063 272,180
Depreciation &
amortization 57,331 122,403 41,063
(3) 220,797
Identifiable assets 1,853,144 1,343,482 1,772,252 (4) 4,968,878
Year ended
December 31, 2007
Net sales 1,992,740 3,233,802 86,964 (347,452) (1) 4,966,054
Income from operations 527,991 361,809 3,717 (60,204) (2) 833,313
Capital expenditure 112,973 213,293 8,503 334,769
Depreciation &
amortization 68,981 118,100 7,682 38,050
(3) 232,813
Identifiable assets 2,321,204 1,405,299 1,937,292 1,493,471
(4) 7,157,266
Year ended
December 31, 2008
Net sales 2,472,330 3,109,146 (379,865) (1) 5,201,611
Income from operations 545,507 291,469 (87,213) (2) 749,763
Capital expenditure 125,489 170,947 296,436
Depreciation &
amortization 85,987 123,129 55,822
(3) 264,938
Identifiable assets 2,750,081 1,528,410 3,026,734 (4) 7,305,225