LensCrafters 2008 Annual Report Download - page 59
Download and view the complete annual report
Please find page 59 of the 2008 LensCrafters annual report below. You can navigate through the pages in the report by either clicking on the pages listed below, or by using the keyword search tool below to find specific information within the annual report.-
 1
1 -
2
-
3
-
4
-
5
-
6
-
7
-
8
-
9
-
10
-
11
-
12
-
13
-
14
-
15
-
16
-
17
-
18
-
19
-
20
-
21
-
22
-
23
-
24
-
25
-
26
-
27
-
28
-
29
-
30
-
31
-
32
-
33
-
34
-
35
-
36
-
37
-
38
-
39
-
40
-
41
-
42
-
43
-
44
-
45
-
46
-
47
-
48
-
 49
49 -
 50
50 -
 51
51 -
 52
52 -
 53
53 -
 54
54 -
 55
55 -
 56
56 -
 57
57 -
 58
58 -
 59
59 -
 60
60 -
 61
61 -
 62
62 -
 63
63 -
 64
64 -
 65
65 -
 66
66 -
 67
67 -
 68
68 -
 69
69 -
70
-
71
-
72
-
73
-
74
-
75
-
76
-
77
-
78
-
79
-
80
-
81
-
82
-
83
-
84
-
85
-
86
-
87
-
88
-
89
-
90
-
91
-
92
-
93
-
94
-
95
-
96
-
97
-
98
-
99
-
100
-
101
-
102
-
103
-
104
-
105
-
106
-
107
-
108
-
109
-
110
-
111
-
112
-
113
-
114
-
115
-
116
-
117
-
118
-
119
-
120
 |
 |

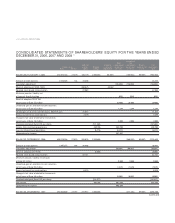
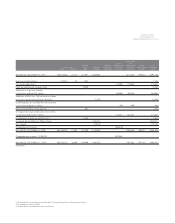
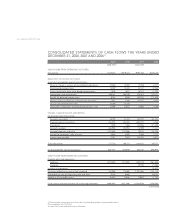
CONSOLIDATED
STATEMENTS OF CASH FLOWS |57 <
CASH FLOWS FROM FINANCING ACTIVITIES:
Long-term debt:
Proceeds 1,385,927 995,709 2,145,428 84,100
Repayments (1,399,490) (1,005,453) (675,834) (233,378)
Repayment of acquired lines of credit (166,577)
(Decrease) increase in overdraft balances (42,551) (30,570) 282,280 (101,008)
Exercise of stock options 9,919 7,126 26,642 24,443
Excess tax benefit from stock-based compensation 878 631 6,313 7,279
Dividends (311,253) (223,617) (191,077) (131,369)
Cash used in financing activities of continuing operations (356,569) (256,174) 1,427,174 (349,933)
(DECREASE) INCREASE IN CASH AND CASH EQUIVALENTS 190 137 (30,114) (10,395)
CASH AND EQUIVALENTS, BEGINNING OF YEAR 421,599 302,894 339,122 367,461
Effect of exchange rate changes on cash and cash equivalents (20,296) (14,582) (6,114) (17,944)
CASH AND EQUIVALENTS, END OF YEAR 401,493 288,450 302,894 339,122
Cash provided by (used in) operating activities of discontinued operations (5,688)
Cash provided by (used in) investing activities of discontinued operations (9,186)
Cash provided by (used in) financing activities of discontinued operations 16,209
(DECREASE) INCREASE IN CASH AND CASH EQUIVALENTS
OF DISCONTINUED OPERATIONS 1,334
CASH RECLASSIFIED AS ASSETS OF DISCONTINUED
OPERATION AT BEGINNING OF YEAR 4,795
EFFECT OF TRANSLATION ADJUSTMENTS ON CASH
AND CASH EQUIVALENTS OF DISCONTINUED OPERATIONS (557)
CASH RETAINED BY DISCONTINUED OPERATIONS UPON SALE (5,572)
CASH INCLUDED IN ASSETS OF DISCONTINUED OPERATION
AT END OF PERIOD
SUPPLEMENTAL DISCLOSURE OF CASH FLOWS INFORMATION:
Cash paid during the year for interest 168,672 121,181 73,202 67,496
Cash paid during the year for income taxes 370,390 266,104 454,062 242,628
Property and equipment purchases in accounts payable 16,307 11,716 26,820 14,822
Acquisition of businesses:
Fair value of assets acquired 12,956 9,308 545,129 10,863
2008 2008 2007 2006
(US$ 000) (1) (Euro 000)