LensCrafters 2008 Annual Report Download - page 113
Download and view the complete annual report
Please find page 113 of the 2008 LensCrafters annual report below. You can navigate through the pages in the report by either clicking on the pages listed below, or by using the keyword search tool below to find specific information within the annual report.-
 1
1 -
2
-
3
-
4
-
5
-
6
-
7
-
8
-
9
-
10
-
11
-
12
-
13
-
14
-
15
-
16
-
17
-
18
-
19
-
20
-
21
-
22
-
23
-
24
-
25
-
26
-
27
-
28
-
29
-
30
-
31
-
32
-
33
-
34
-
35
-
36
-
37
-
38
-
39
-
40
-
41
-
42
-
43
-
44
-
45
-
46
-
47
-
48
-
49
-
50
-
51
-
52
-
53
-
54
-
55
-
56
-
57
-
58
-
59
-
60
-
61
-
62
-
63
-
64
-
65
-
66
-
67
-
68
-
69
-
70
-
71
-
72
-
73
-
74
-
75
-
76
-
77
-
78
-
79
-
80
-
81
-
82
-
83
-
84
-
85
-
86
-
87
-
88
-
89
-
90
-
91
-
92
-
93
-
94
-
95
-
96
-
97
-
98
-
99
-
100
-
101
-
102
-
 103
103 -
 104
104 -
 105
105 -
 106
106 -
 107
107 -
 108
108 -
 109
109 -
 110
110 -
 111
111 -
 112
112 -
 113
113 -
 114
114 -
 115
115 -
 116
116 -
 117
117 -
 118
118 -
 119
119 -
 120
120
 |
 |

ANNEXES |111 <
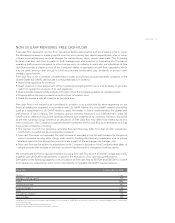
NON US GAAP MEASURES: FREE CASH FLOW
Free cash flow represents income from operations before depreciation and amortization, plus or minus
the decrease/(increase) in working capital over the prior period, less capital expenditures, plus or minus
interest income/(expense) and net charges for extraordinary items, minus taxes paid. The Company
believes that free cash flow is useful to both management and investors in evaluating the Company’s
operating performance compared to other companies in its industry. In particular, our calculation of free
cash flow provides a clearer picture of the Company’s ability to generate net cash from operations, which
may be used, among other things, to fund discretionary investments, pay dividends or pursue other
strategic opportunities.
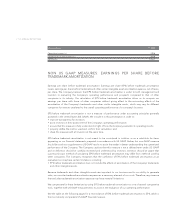
Free cash flow is not a measure of performance under accounting principles generally accepted in the
United States (US GAAP). We include it in this presentation in order to:
• Improve transparency for investors;
• Assist investors in their assessment of the Company’s operating performance and its ability to generate
cash from operations in excess of its cash expenses;
• Ensure that this measure is fully understood in light of how the Company evaluates its operating results;
• Properly define the metrics used and confirm their calculation; and
• Share this measure with all investors at the same time.
Free cash flow is not meant to be considered in isolation or as a substitute for items appearing on our
financial statements prepared in accordance with US GAAP. Rather, this non-GAAP measure should be
used as a supplement to US GAAP results to assist the reader in better understanding the operational
performance of the Company. The Company cautions that this measure is not a defined term under US
GAAP and its definition should be carefully reviewed and understood by investors. Investors should be
aware that Luxottica Group’s method of calculation of free cash flow may differ from methods used by
other companies. The Company recognizes that the usefulness of free cash flow as an evaluative tool may
have certain limitations, including:
• The manner in which the Company calculates free cash flow may differ from that of other companies,
which limits its usefulness as a comparative measure;
• Free cash flow does not represent the total increase or decrease in the net debt balance for the period
since it excludes, among other things, cash used for funding discretionary investments and to pursue
strategic opportunities during the period and any impact of the exchange rate changes; and
• Free cash flow can be subject to adjustment at the Company’s discretion if the Company takes steps or
adopts policies that increase or diminish its current liabilities and/or changes to working capital.
We compensate for the foregoing limitations by using free cash flow as one of several comparative tools,
together with US GAAP measurements, to assist in the evaluation of our operating performance.
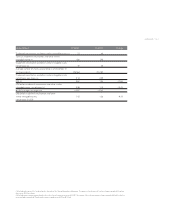
See tables on the following pages for a reconciliation of free cash flow to EBITDA and EBITDA to income
from operations, respectively, which is the most directly comparable US GAAP financial measure.
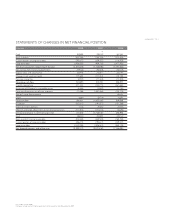
(Euro 000) At December 31, 2008
EBITDA (1) 1,015
Change in working capital (77)
Capex (296)
Operating cash flow 641
Financial charges (2) (122)
Taxes (202)
Extraordinary charges (3) (15)
Free cash flow 302
(1) EBITDA is not a measure in accordance with US GAAP. For a reconciliation of EBITDA to income from operations, the nearest US GAAP measure, see the table
on the following page
(2) Equals interest income minus interest expenses
(3) Equals extraordinary income minus extraordinary expenses