LensCrafters 2008 Annual Report Download - page 58
Download and view the complete annual report
Please find page 58 of the 2008 LensCrafters annual report below. You can navigate through the pages in the report by either clicking on the pages listed below, or by using the keyword search tool below to find specific information within the annual report.-
 1
1 -
2
-
3
-
4
-
5
-
6
-
7
-
8
-
9
-
10
-
11
-
12
-
13
-
14
-
15
-
16
-
17
-
18
-
19
-
20
-
21
-
22
-
23
-
24
-
25
-
26
-
27
-
28
-
29
-
30
-
31
-
32
-
33
-
34
-
35
-
36
-
37
-
38
-
39
-
40
-
41
-
42
-
43
-
44
-
45
-
46
-
47
-
 48
48 -
 49
49 -
 50
50 -
 51
51 -
 52
52 -
 53
53 -
 54
54 -
 55
55 -
 56
56 -
 57
57 -
 58
58 -
 59
59 -
 60
60 -
 61
61 -
 62
62 -
 63
63 -
 64
64 -
 65
65 -
 66
66 -
 67
67 -
 68
68 -
69
-
70
-
71
-
72
-
73
-
74
-
75
-
76
-
77
-
78
-
79
-
80
-
81
-
82
-
83
-
84
-
85
-
86
-
87
-
88
-
89
-
90
-
91
-
92
-
93
-
94
-
95
-
96
-
97
-
98
-
99
-
100
-
101
-
102
-
103
-
104
-
105
-
106
-
107
-
108
-
109
-
110
-
111
-
112
-
113
-
114
-
115
-
116
-
117
-
118
-
119
-
120
 |
 |
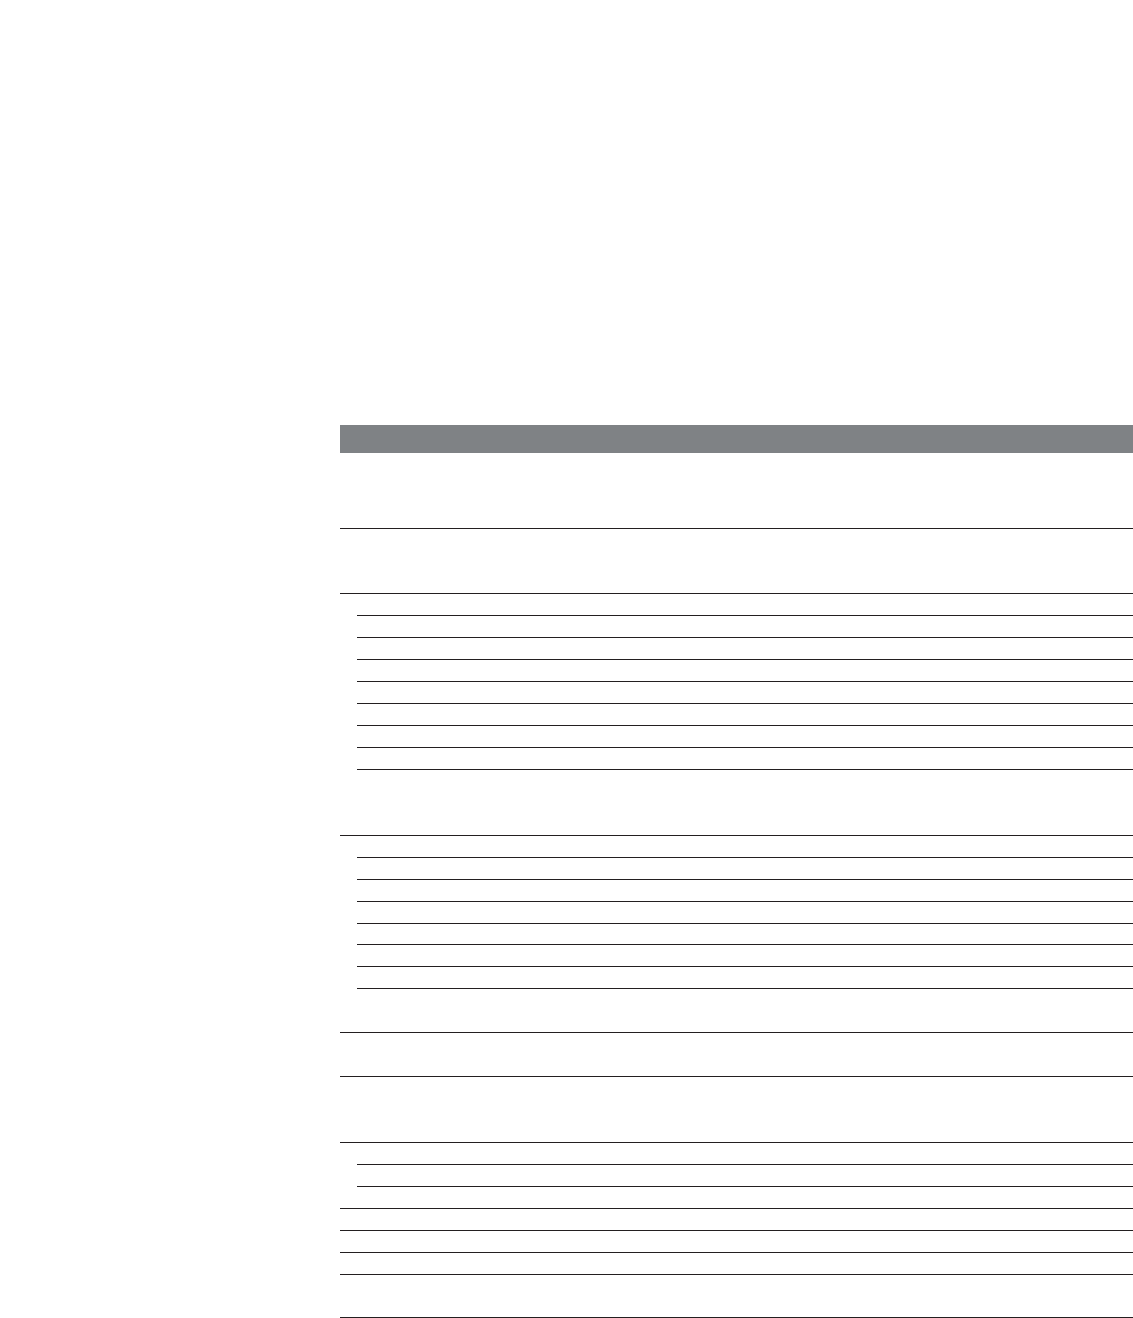
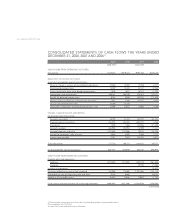
> 56 |ANNUAL REPORT 2008
CONSOLIDATED STATEMENTS OF CASH FLOWS THE YEARS ENDED
DECEMBER 31, 2008, 2007 AND 2006 (*)
2008 2008 2007 2006
(US$ 000) (1) (Euro 000)
CASH FLOWS FROM OPERATING ACTIVITIES:
Net income $528,535 379,722 492,204 430,705
Adjustments to reconcile net income
to net cash provided by operating activitities:
Minority interest in income of consolidated subsidiaries 21,563 15,492 14,976 8,715
Stock-based compensation 14,509 10,424 42,121 47,969
Excess tax benefits from stock-based compensation (878) (631) (6,313) (7,279)
Depreciation and amortization 368,767 264,938 232,813 220,797
Benefit for deferred income taxes 6,762 4,858 (45,037) (72,509)
Net loss (Gain) on disposals of fixed assets and other 2,851 2,048 (19,337) 4,930
Loss on sale of promissory note 32,298 23,204
Termination indemnities matured during the year - net (2,049) (1,472) (3,595) 4,369
Changes in operating assets and liabilities,
net of acquisition of businesses:
Accounts receivable 38,799 27,875 (55,707) (83,107)
Prepaid expenses and other (36,391) (26,145) (220,727) 8,568
Inventories 1,904 1,368 (41,916) (27,658)
Accounts payable (26,993) (19,393) 32,989 71,723
Accrued expenses and other (153,646) (110,386) (9,433) (25,243)
Accrual for customers’ right of return 5,692 4,090 9,855 11,121
Income taxes payable 4,041 2,903 (92,142) 5,875
Total adjustments 277,228 199,173 (161,453) 168,271
Cash provided by operating activities 805,763 578,895 330,751 598,976
CASH FLOWS FROM INVESTING ACTIVITIES:
Property, plant and equipment:
Additions (433,632) (311,540) (322,770) (267,882)
Disposals 29,700 21,563
Increase in investments (5,872)
Purchases of businesses net of cash acquired (18,496) (13,288) (1,491,086) (134,114)
Proceeds from sale of Promissory note and other 9,576 6,880 128,007
Additions of intangible assets (6,452) (4,636) (3,883) (1,140)
Cash used in investing activities of continuing operations (449,004) (322,584) (1,788,039) (259,439)
(Continued)
(1) Translated for convenience at the New York City Noon Buying Rate as determined in Note 1
(*) In accordance with US GAAP
See notes to the consolidated financial statements