LensCrafters 2008 Annual Report Download - page 108
Download and view the complete annual report
Please find page 108 of the 2008 LensCrafters annual report below. You can navigate through the pages in the report by either clicking on the pages listed below, or by using the keyword search tool below to find specific information within the annual report.-
 1
1 -
2
-
3
-
4
-
5
-
6
-
7
-
8
-
9
-
10
-
11
-
12
-
13
-
14
-
15
-
16
-
17
-
18
-
19
-
20
-
21
-
22
-
23
-
24
-
25
-
26
-
27
-
28
-
29
-
30
-
31
-
32
-
33
-
34
-
35
-
36
-
37
-
38
-
39
-
40
-
41
-
42
-
43
-
44
-
45
-
46
-
47
-
48
-
49
-
50
-
51
-
52
-
53
-
54
-
55
-
56
-
57
-
58
-
59
-
60
-
61
-
62
-
63
-
64
-
65
-
66
-
67
-
68
-
69
-
70
-
71
-
72
-
73
-
74
-
75
-
76
-
77
-
78
-
79
-
80
-
81
-
82
-
83
-
84
-
85
-
86
-
87
-
88
-
89
-
90
-
91
-
92
-
93
-
94
-
95
-
96
-
97
-
 98
98 -
 99
99 -
 100
100 -
 101
101 -
 102
102 -
 103
103 -
 104
104 -
 105
105 -
 106
106 -
 107
107 -
 108
108 -
 109
109 -
 110
110 -
 111
111 -
 112
112 -
 113
113 -
 114
114 -
 115
115 -
 116
116 -
 117
117 -
 118
118 -
119
-
120
 |
 |

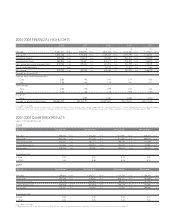
> 106 |ANNUAL REPORT 2008
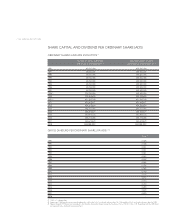
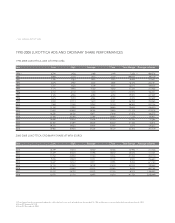
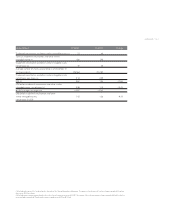
SHARE CAPITAL AND DIVIDEND PER ORDINARY SHARE (ADS)
Euro (3)
1990 0.025
1991 0.028
1992 0.031
1993 0.037
1994 0.041
1995 0.045
1996 0.052
1997 0.063
1998 0.074
1999 0.085
2000 0.140
2001 0.170
2002 0.210
2003 0.210
2004 0.230
2005 0.290
2006 0.420
2007 0.490
2008 -
Number of shares authorized Adjusted number of shares
and issued as of December 31 authorized as of December 31 (2)
1990 45,050,000 450,500,000
1991 45,050,000 450,500,000
1992 45,050,000 450,500,000
1993 45,050,000 450,500,000
1994 45,050,000 450,500,000
1995 45,050,000 450,500,000
1996 45,050,000 450,500,000
1997 45,050,000 450,500,000
1998 (1) 225,250,000 450,500,000
1999 225,269,800 450,539,600
2000 (1) 451,582,300 451,582,300
2001 452,865,817 452,865,817
2002 454,263,600 454,263,600
2003 454,477,033 454,477,033
2004 455,205,473 455,205,473
2005 457,975,723 457,975,723
2006 460,216,248 460,216,248
2007 462,623,620 462,623,620
2008 463,368,233 463,368,233
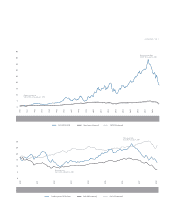
ORDINARY SHARES AND ADS EVOLUTION (1)
GROSS DIVIDEND PER ORDINARY SHARE (OR ADS) (1)(2)
(1) 1 ADS = 1 ordinary share
(2) Figures until 1999 have been retroactively adjusted to reflect the 5-for-1 stock split effective April 16, 1998, and the 2-for-1 stock split effective June 26, 2000.
(3) Figures through 1999 have been calculated converting the dividend in Italian Lira by the fixed rate of Lire 1,936.27 = Euro 1.00. Beginning with the 2000 finan-
cial statements the dividend is declared in Euro.