LensCrafters 2008 Annual Report Download - page 8
Download and view the complete annual report
Please find page 8 of the 2008 LensCrafters annual report below. You can navigate through the pages in the report by either clicking on the pages listed below, or by using the keyword search tool below to find specific information within the annual report.-
 1
1 -
 2
2 -
 3
3 -
 4
4 -
 5
5 -
 6
6 -
 7
7 -
 8
8 -
 9
9 -
 10
10 -
 11
11 -
 12
12 -
 13
13 -
 14
14 -
 15
15 -
 16
16 -
 17
17 -
 18
18 -
 19
19 -
20
-
21
-
22
-
23
-
24
-
25
-
26
-
27
-
28
-
29
-
30
-
31
-
32
-
33
-
34
-
35
-
36
-
37
-
38
-
39
-
40
-
41
-
42
-
43
-
44
-
45
-
46
-
47
-
48
-
49
-
50
-
51
-
52
-
53
-
54
-
55
-
56
-
57
-
58
-
59
-
60
-
61
-
62
-
63
-
64
-
65
-
66
-
67
-
68
-
69
-
70
-
71
-
72
-
73
-
74
-
75
-
76
-
77
-
78
-
79
-
80
-
81
-
82
-
83
-
84
-
85
-
86
-
87
-
88
-
89
-
90
-
91
-
92
-
93
-
94
-
95
-
96
-
97
-
98
-
99
-
100
-
101
-
102
-
103
-
104
-
105
-
106
-
107
-
108
-
109
-
110
-
111
-
112
-
113
-
114
-
115
-
116
-
117
-
118
-
119
-
120
 |
 |
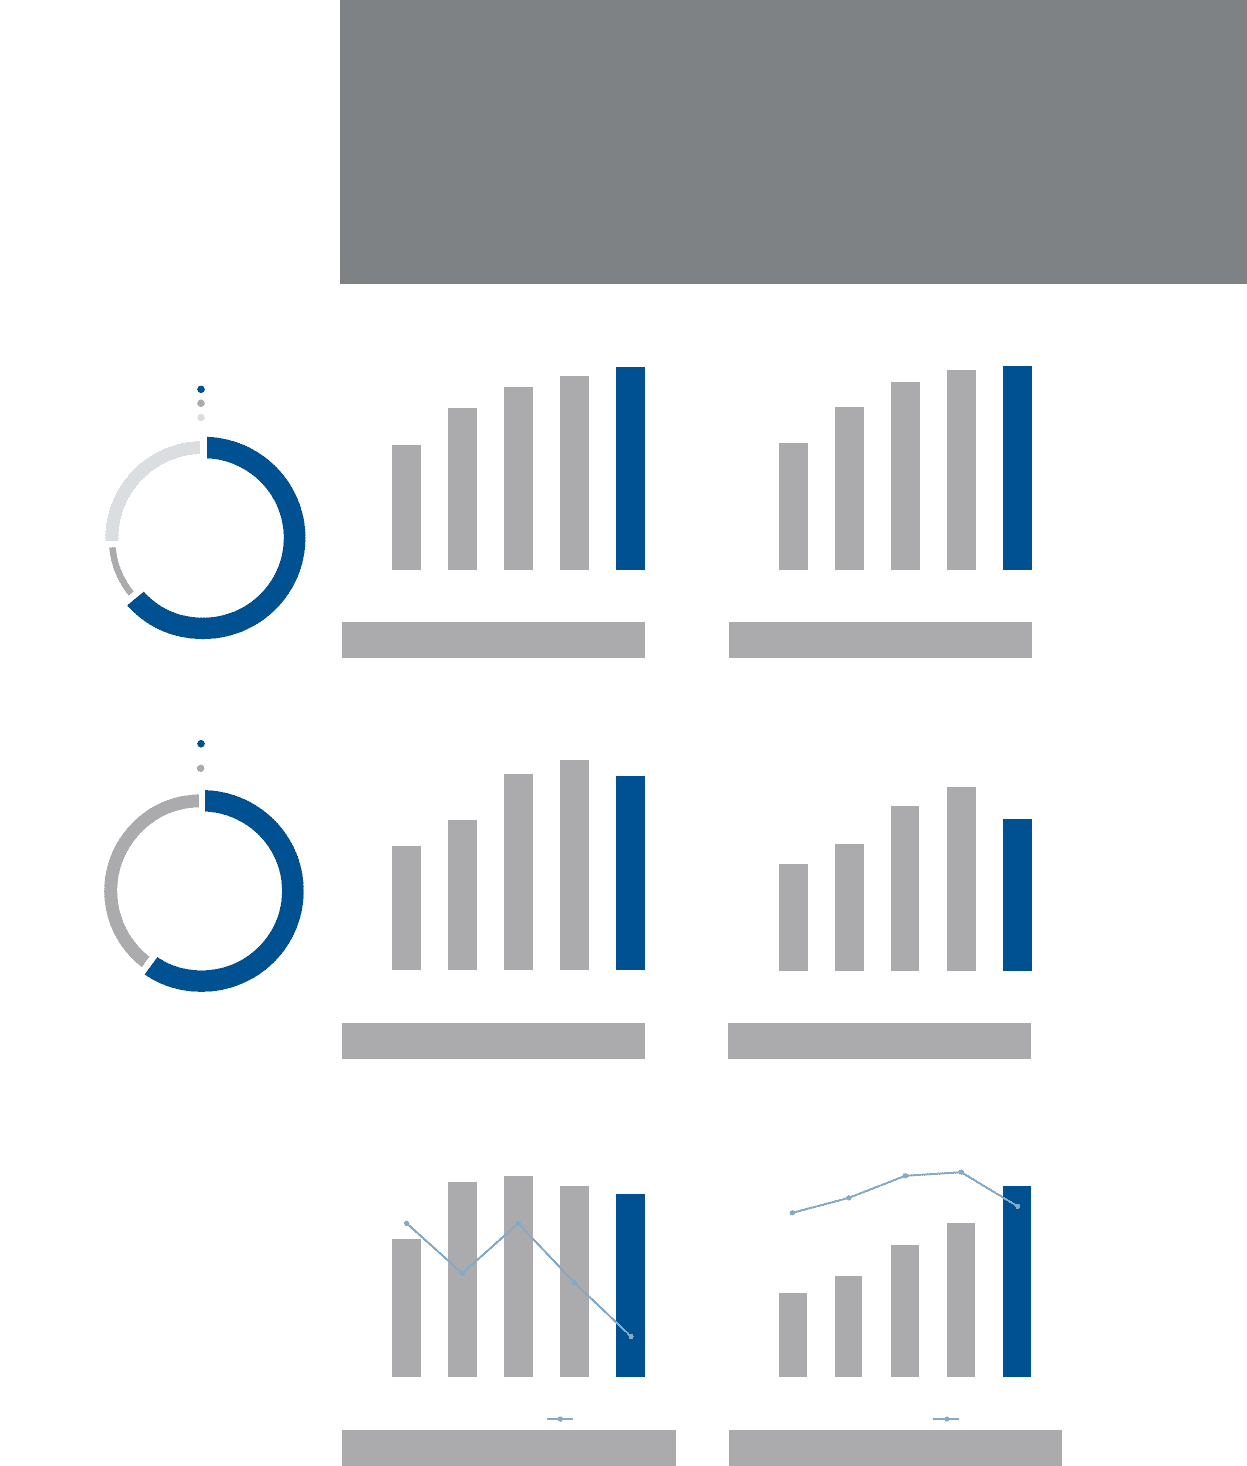
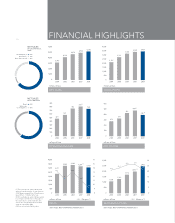
FINANCIAL HIGHLIGHTS
3,180
2004 2005 2006 2007 2008
4,134
4,676 4,966 5,202
0
1,000
2,000
3,000
4,000
5,000
6,000
millions of Euro
2004 2005 2006 2007 2008
3,062 3,294 3,234 (3)
3,109
13.1
11.6
13.1
11.2
9.4
0
500
1,000
1,500
2,000
2,500
3,000
3,500
4,000
8
9
10
11
12
13
14
15
16
2,271
millions of Euro Margin in %
2004 2005 2006 2007 2008
1,095
1,310
1,715
1,993 (3)
2,472
21.3
23.2
26.0 26.5
22.1
0
500
1,000
1,500
2,000
2,500
3,000
0
5
10
15
20
25
30
millions of Euro
NET SALES AND OPERATING MARGIN IN % NET SALES AND OPERATING MARGIN IN %
Margin in %
NET SALES
2004 2005 2006 2007 2008
millions of Euro
479
581
756
813 (1)
750
0
100
200
300
400
500
600
700
800
900
OPERATING INCOME
2004 2005 2006 2007 2008
279
331
431
479 (1)
395 (2)
0
100
200
300
400
500
600
millions of Euro
NET INCOME
RETAIL WHOLESALE (TOTAL)
2004 2005 2006 2007 2008
2,127
2,761
3,188 3,390 3,457
0
500
1,000
1,500
2,000
2,500
3,000
3,500
4,000
millions of Euro
GROSS PROFIT
NET SALES
BY GEOGRAPHICAL
AREA
North America
Asia-Pacific
Rest of the world
64%
10%
26%
NET SALES
BY DISTRIBUTION
Retail
Wholesale
to third parties
60%
40%
> 6
(1) This excludes an extraordinary item
arising from the transfer of real estate in
2Q07 (approximately Euro 20 million pre-
tax and Euro 13 million after tax).
(2) This excludes an extraordinary capital
loss of Euro 15 million net of tax due to
the write-off of a credit related to the
sale of the Things Remembered retail
chain in September 2006.
(3) Does not include Oakley sales.