LensCrafters 2008 Annual Report Download - page 53
Download and view the complete annual report
Please find page 53 of the 2008 LensCrafters annual report below. You can navigate through the pages in the report by either clicking on the pages listed below, or by using the keyword search tool below to find specific information within the annual report.-
 1
1 -
2
-
3
-
4
-
5
-
6
-
7
-
8
-
9
-
10
-
11
-
12
-
13
-
14
-
15
-
16
-
17
-
18
-
19
-
20
-
21
-
22
-
23
-
24
-
25
-
26
-
27
-
28
-
29
-
30
-
31
-
32
-
33
-
34
-
35
-
36
-
37
-
38
-
39
-
40
-
41
-
42
-
 43
43 -
 44
44 -
 45
45 -
 46
46 -
 47
47 -
 48
48 -
 49
49 -
 50
50 -
 51
51 -
 52
52 -
 53
53 -
 54
54 -
 55
55 -
 56
56 -
 57
57 -
 58
58 -
 59
59 -
 60
60 -
 61
61 -
 62
62 -
 63
63 -
64
-
65
-
66
-
67
-
68
-
69
-
70
-
71
-
72
-
73
-
74
-
75
-
76
-
77
-
78
-
79
-
80
-
81
-
82
-
83
-
84
-
85
-
86
-
87
-
88
-
89
-
90
-
91
-
92
-
93
-
94
-
95
-
96
-
97
-
98
-
99
-
100
-
101
-
102
-
103
-
104
-
105
-
106
-
107
-
108
-
109
-
110
-
111
-
112
-
113
-
114
-
115
-
116
-
117
-
118
-
119
-
120
 |
 |

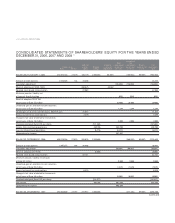
CONSOLIDATED
STATEMENT OF INCOME |51 <
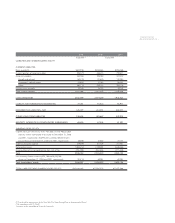
CONSOLIDATED STATEMENTS OF INCOME FOR THE YEARS ENDED
DECEMBER 31, 2008, 2007 AND 2006 (*)
2008 2008 2007 2006
(US$ 000) (1) (Euro 000)
NET SALES $7,240,123 5,201,611 4,966,054 4,676,156
COST OF SALES (2,428,735) (1,744,907) (1,575,618) (1,487,700)
GROSS PROFIT 4,811,387 3,456,705 3,390,436 3,188,456
OPERATING EXPENSES:
Selling and advertising (3,008,412) (2,161,371) (2,069,280) (1,948,466)
General and administrative (759,380) (545,571) (487,843) (484,002)
Total (3,767,793) (2,706,942) (2,557,123) (2,432,468)
INCOME FROM OPERATIONS 1,043,595 749,763 833,313 755,987
OTHER INCOME (EXPENSE):
Interest income 18,464 13,265 17,087 9,804
Interest expense (188,278) (135,267) (89,498) (70,622)
Other - net (52,739) (37,890) 19,780 (16,992)
Other expense - net (222,554) (159,892) (52,631) (77,810)
INCOME BEFORE PROVISION FOR INCOME TAXES 821,041 589,870 780,681 678,177
PROVISION FOR INCOME TAXES (270,943) (194,657) (273,501) (238,757)
INCOME BEFORE MINORITY INTERESTS
IN CONSOLIDATED SUBSIDIARIES 550,097 395,213 507,180 439,420
MINORITY INTERESTS IN INCOME
OF CONSOLIDATED SUBSIDIARIES (21,563) (15,492) (14,976) (8,715)
NET INCOME FROM CONTINUING OPERATIONS 528,535 379,722 492,204 430,705
DISCONTINUED OPERATIONS, NET OF TAXES (6,419)
NET INCOME $528,535 379,722 492,204 424,286
EARNINGS PER SHARE: BASIC
Continuing operations 1.16 0.83 1.08 0.95
Discontinued operations (0.01)
Net income 1.16 0.83 1.08 0.94
EARNINGS PER SHARE: DILUTED
Continuing operations 1.15 0.83 1.07 0.94
Discontinued operations (0.01)
Net income 1.15 0.83 1.07 0.93
WEIGHTED AVERAGE NUMBER OF SHARES OUTSTANDING
Basic 456,563,502 456,563,502 455,184,797 452,897,854
Diluted 457,717,044 457,717,044 458,530,609 456,185,650
(1) Translated for convenience at the New York City Noon Buying Rate as determined in Note 1
(*) In accordance with US GAAP
See notes to the consolidated financial statements