LensCrafters 2008 Annual Report Download - page 56
Download and view the complete annual report
Please find page 56 of the 2008 LensCrafters annual report below. You can navigate through the pages in the report by either clicking on the pages listed below, or by using the keyword search tool below to find specific information within the annual report.-
 1
1 -
2
-
3
-
4
-
5
-
6
-
7
-
8
-
9
-
10
-
11
-
12
-
13
-
14
-
15
-
16
-
17
-
18
-
19
-
20
-
21
-
22
-
23
-
24
-
25
-
26
-
27
-
28
-
29
-
30
-
31
-
32
-
33
-
34
-
35
-
36
-
37
-
38
-
39
-
40
-
41
-
42
-
43
-
44
-
45
-
 46
46 -
 47
47 -
 48
48 -
 49
49 -
 50
50 -
 51
51 -
 52
52 -
 53
53 -
 54
54 -
 55
55 -
 56
56 -
 57
57 -
 58
58 -
 59
59 -
 60
60 -
 61
61 -
 62
62 -
 63
63 -
 64
64 -
 65
65 -
 66
66 -
67
-
68
-
69
-
70
-
71
-
72
-
73
-
74
-
75
-
76
-
77
-
78
-
79
-
80
-
81
-
82
-
83
-
84
-
85
-
86
-
87
-
88
-
89
-
90
-
91
-
92
-
93
-
94
-
95
-
96
-
97
-
98
-
99
-
100
-
101
-
102
-
103
-
104
-
105
-
106
-
107
-
108
-
109
-
110
-
111
-
112
-
113
-
114
-
115
-
116
-
117
-
118
-
119
-
120
 |
 |

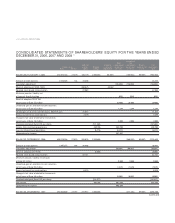
>54 |ANNUAL REPORT 2008
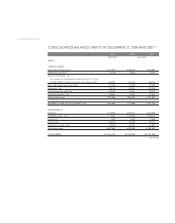
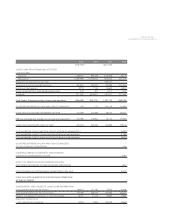
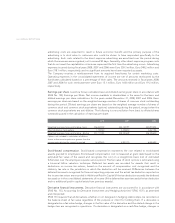
CONSOLIDATED STATEMENTS OF SHAREHOLDERS’ EQUITY FOR THE YEARS ENDED
DECEMBER 31, 2006, 2007 AND 2008 (*)
Accumulated
Other other
Additional Unearned comprehensive comprehensive Treasury Total
Common stock paid-in Retained stock-based income (loss) income (loss) shares amount, shareholders’
Shares Amount capital earnings compensation net of tax net of tax at cost equity
BALANCES AT JANUARY 1, 2006 457,975,723 27,479 150,179 2,050,883 (48,567) (155,954) (69,987) 1,954,033
Exercise of stock options 2,240,525 134 24,308 24,443
Translation adjustment (126,853) (126,853) (126,853)
Effect of adoption of SFAS 123 R (48,567) 48,567
Realized stock based compensation 47,969 47,969
Minimum pension, liability,net
of taxes of Euro 0.4 million (624) (624) (624)
Effect of adoption SFAS 158,
net of taxes of Euro 5.5 million (8,409) (8,409) (8,409)
Unrealized gain on available-for-sale securities,
net of taxes of Euro0.5 million 1,244 1,244 1,244
Diluted gain on business combinations, SAB 5-H gain 21,847 21,847
Excess tax benefit on stock options 7,279 7,279
Change in fair value of derivative instruments,
net of taxes of Euro1.8 million 2,003 2,003 2,003
Dividends declared (Euro 0.29 per share) (131,369) (131,369)
Income from continuing operations 430,705 430,705 430,705
(Loss) on discontinued operations (6,419) (6,419) (6,419)
Comprehensive income 291,647
BALANCES, DECEMBER 31, 2006 460,216,248 27,613 203,016 2,343,800 (288,593) (69,987) 2,215,849
Exercise of stock options 2,407,372 144 26,498 26,642
Translation adjustment (90,881) (90,881) (90,881)
Effect of adoption of FIN 48 (8,060) (8,060)
Realized stock based compensation 42,121 42,121
Minimum pension, liability, net of taxes
of Euro 3.9 million 9,688 9,688 9,688
Unrealized gain on available-for-sale securities,
net of taxes of Euro 0.9 million (1,579) (1,579) (1,579)
Excess tax benefit on stock options 6,313 6,313
Change in fair value of derivative instruments,
net of taxes of Euro4.6 million (6,062) (6,062) (6,062)
Dividends declared (Euro0.42 per share) (191,077) (191,077)
Net income 492,204 492,204 492,204
Comprehensive income 403,369
BALANCES, DECEMBER 31, 2007 462,623,620 27,757 277,947 2,636,868 (377,428) (69,987) 2,495,158
(Continued)