Kraft 2002 Annual Report Download - page 61
Download and view the complete annual report
Please find page 61 of the 2002 Kraft annual report below. You can navigate through the pages in the report by either clicking on the pages listed below, or by using the keyword search tool below to find specific information within the annual report.-
 1
1 -
2
-
3
-
4
-
5
-
6
-
7
-
8
-
9
-
10
-
11
-
12
-
13
-
14
-
15
-
16
-
17
-
18
-
19
-
20
-
21
-
22
-
23
-
24
-
25
-
26
-
27
-
28
-
29
-
30
-
31
-
32
-
33
-
34
-
35
-
36
-
37
-
38
-
39
-
40
-
41
-
42
-
43
-
44
-
45
-
46
-
47
-
48
-
49
-
50
-
 51
51 -
 52
52 -
 53
53 -
 54
54 -
 55
55 -
 56
56 -
 57
57 -
 58
58 -
 59
59 -
 60
60 -
 61
61 -
 62
62 -
 63
63 -
 64
64 -
 65
65 -
 66
66 -
 67
67 -
 68
68 -
 69
69 -
 70
70
 |
 |

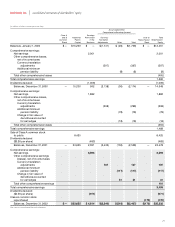
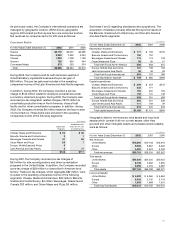
As previously noted, the Company’s international operations are
managed by geographic location. Within its two geographic
regions, KFI’s brand portfolio spans five core consumer sectors.
Net revenues by consumer sector for KFI were as follows:
Consumer Sector
(in millions)
For the Years Ended December 31, 2002 2001 2000
Snacks $3,179 $3,077 $2,565
Beverages 2,832 2,900 3,034
Cheese 1,202 1,208 1,193
Grocery 752 826 544
Convenient Meals 273 253 274
Total $8,238 $8,264 $7,610
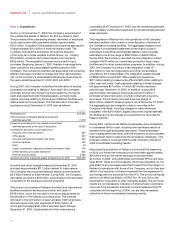
During 2002, the Company sold its Latin American yeast and
industrial bakery ingredients business at a pre-tax gain of
$69 million. This pre-tax gain was included in the operating
companies income of the Latin America and Asia Pacific segment.
In addition, during 2002, the Company recorded a pre-tax
charge of $142 million related to employee acceptances under
a voluntary retirement program. During 2002, the Company also
recorded pre-tax integration related charges of $115 million to
consolidate production lines in North America, close a Kraft
facility and for other consolidation programs. In addition, during
2002, the Company reversed $4 million related to the loss on sale
of a food factory. These items were included in the operating
companies income of the following segments:
(in millions)
Integration costs
Separation and a loss on sale
Programs of a food factory
Cheese, Meals and Enhancers $60 $30
Biscuits, Snacks and Confectionery 31
Beverages, Desserts and Cereals 47 56
Oscar Mayer and Pizza 25 7
Europe, Middle East and Africa 5
Latin America and Asia Pacific 217
$142 $111
During 2001, the Company recorded pre-tax charges of
$53 million for site reconfigurations and other consolidation
programs in the United States. In addition, the Company recorded
a pre-tax charge of $29 million to close a North American food
factory. These pre-tax charges, which aggregate $82 million, were
included in the operating companies income of the following
segments: Cheese, Meals and Enhancers, $63 million; Biscuits,
Snacks and Confectionery, $2 million; Beverages, Desserts and
Cereals, $12 million; and Oscar Mayer and Pizza, $5 million.
See Notes 4 and 5 regarding divestitures and acquisitions. The
acquisition of Nabisco primarily affected the reported results of
the Biscuits, Snacks and Confectionery and the Latin America
and Asia Pacific segments.
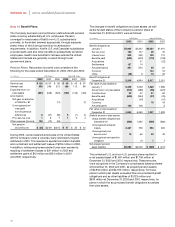
(in millions)
For the Years Ended December 31, 2002 2001 2000
Depreciation expense:
Cheese, Meals and Enhancers $ 177 $ 163 $150
Biscuits, Snacks and Confectionery 156 152
Beverages, Desserts and Cereals 115 113 109
Oscar Mayer and Pizza 58 55 51
Total Kraft Foods North America 506 483 310
Europe, Middle East and Africa 167 158 163
Latin America and Asia Pacific 36 39 26
Total Kraft Foods International 203 197 189
Total depreciation expense $ 709 $ 680 $499
Capital expenditures:
Cheese, Meals and Enhancers $ 249 $ 257 $247
Biscuits, Snacks and Confectionery 232 171
Beverages, Desserts and Cereals 194 202 193
Oscar Mayer and Pizza 133 131 148
Total Kraft Foods North America 808 761 588
Europe, Middle East and Africa 265 231 239
Latin America and Asia Pacific 111 109 79
Total Kraft Foods International 376 340 318
Total capital expenditures $1,184 $1,101 $906
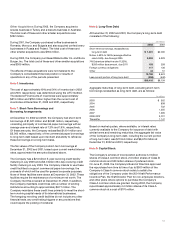
Geographic data for net revenues, total assets and long-lived
assets (which consist of all non-current assets, other than
goodwill and other intangible assets and prepaid pension assets)
were as follows:
(in millions)
For the Years Ended December 31, 2002 2001 2000
Net revenues:
United States $19,395 $19,193 $13,947
Europe 5,908 5,667 6,222
Other 4,420 4,374 2,753
Total net revenues $29,723 $29,234 $22,922
Total assets:
United States $44,406 $44,420 $40,454
Europe 8,738 7,362 7,630
Other 3,956 4,016 3,987
Total assets $57,100 $55,798 $52,071
Long-lived assets:
United States $ 6,382 $ 6,360 $ 6,684
Europe 2,432 2,132 2,116
Other 1,596 1,668 1,912
Total long-lived assets $10,410 $10,160 $10,712
57