Kraft 2002 Annual Report Download - page 37
Download and view the complete annual report
Please find page 37 of the 2002 Kraft annual report below. You can navigate through the pages in the report by either clicking on the pages listed below, or by using the keyword search tool below to find specific information within the annual report.-
 1
1 -
2
-
3
-
4
-
5
-
6
-
7
-
8
-
9
-
10
-
11
-
12
-
13
-
14
-
15
-
16
-
17
-
18
-
19
-
20
-
21
-
22
-
23
-
24
-
25
-
26
-
 27
27 -
 28
28 -
 29
29 -
 30
30 -
 31
31 -
 32
32 -
 33
33 -
 34
34 -
 35
35 -
 36
36 -
 37
37 -
 38
38 -
 39
39 -
 40
40 -
 41
41 -
 42
42 -
 43
43 -
 44
44 -
 45
45 -
 46
46 -
 47
47 -
48
-
49
-
50
-
51
-
52
-
53
-
54
-
55
-
56
-
57
-
58
-
59
-
60
-
61
-
62
-
63
-
64
-
65
-
66
-
67
-
68
-
69
-
70
 |
 |

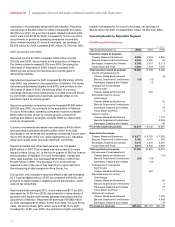
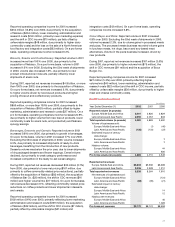
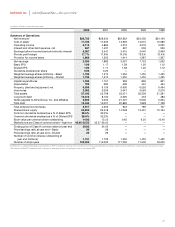
Kraft Foods North America (continued)
(in millions)
Year Ended December 31, 2002 2001 2000
Reported operating
companies income:
Cheese, Meals and Enhancers $2,168 $2,099 $1,845
Biscuits, Snacks and Confectionery 1,093 966 100
Beverages, Desserts and Cereals 1,136 1,192 1,090
Oscar Mayer and Pizza 556 539 512
Total reported operating
companies income 4,953 4,796 3,547
Gains on sales of businesses:
Cheese, Meals and Enhancers (33)
Biscuits, Snacks and Confectionery (8)
Operating companies income of
businesses sold:
Cheese, Meals and Enhancers (4)
Biscuits, Snacks and Confectionery (5) (4)
Beverages, Desserts and Cereals (2)
Integration costs and a loss on
sale of a food factory:
Cheese, Meals and Enhancers 30 63
Biscuits, Snacks and Confectionery 12
Beverages, Desserts and Cereals 56 12
Oscar Mayer and Pizza 75
Separation programs:
Cheese, Meals and Enhancers 60
Biscuits, Snacks and Confectionery 3
Beverages, Desserts and Cereals 47
Oscar Mayer and Pizza 25
Changes due to businesses
held for sale:
Cheese, Meals and Enhancers 23
Estimated impact of century
date change:
Cheese, Meals and Enhancers 15
Biscuits, Snacks and Confectionery 1
Beverages, Desserts and Cereals 7
Oscar Mayer and Pizza 4
Nabisco operating
companies income:
Cheese, Meals and Enhancers 230
Biscuits, Snacks and Confectionery 671
Beverages, Desserts and Cereals 28
Pro forma operating
companies income $5,169 $4,895 $4,466
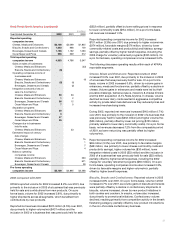
2002 compared with 2001
KFNA’s reported volume for 2002 increased 8.2% over 2001, due
primarily to the inclusion in 2002 of a business that was previously
held for sale and contributions from new products. On a pro
forma basis, volume for 2002 increased 2.8%, due primarily to
higher shipments across all segments, which benefited from
contributions by new products.
Reported net revenues increased $515 million (2.5%) over 2001,
due primarily to higher volume/mix ($437 million) and the
inclusion in 2002 of a business that was previously held for sale
($252 million), partially offset by lower selling prices in response
to lower commodity costs ($154 million). On a pro forma basis,
net revenues increased 1.3%.
Reported operating companies income for 2002 increased
$157 million (3.3%) over 2001, due primarily to higher volume/mix
($174 million), favorable margins ($176 million, driven by lower
commodity-related costs and productivity) and Nabisco synergy
savings, partially offset by higher benefit expense, including the
2002 charge for voluntary retirement programs ($135 million). On
a pro forma basis, operating companies income increased 5.6%.
The following discusses operating results within each of KFNA’s
reportable segments.
Cheese, Meals and Enhancers: Reported volume in 2002
increased 13.0% over 2001, due primarily to the inclusion in 2002
of a business that was previously held for sale. On a pro forma
basis, volume in 2002 increased 0.5%, driven by volume gains in
enhancers, meals and food service, partially offset by a decline in
cheese. Volume gains in enhancers and meals were led by Kraft
pourable dressings, barbecue sauce, macaroni & cheese dinners
and the 2001 acquisition of It’s Pasta Anytime. In cheese, volume
declined as lower dairy costs resulted in aggressive competitive
activity by private label manufacturers as they reduced prices and
increased merchandising levels.
During 2002, reported net revenues increased $145 million (1.7%)
over 2001, due primarily to the inclusion in 2002 of a business that
was previously held for sale ($252 million) and higher volume/mix
($36 million), partially offset by lower net pricing ($135 million,
primarily related to lower dairy commodity costs). On a pro forma
basis, net revenues decreased 1.2% from the comparable period
of 2001, as lower net pricing was partially offset by higher
volume/mix.
Reported operating companies income for 2002 increased
$69 million (3.3%) over 2001, due primarily to favorable margins
($48 million, due primarily to lower cheese commodity costs and
productivity savings), higher volume/mix ($30 million), lower
integration related costs in 2002 ($33 million) and the inclusion in
2002 of a business that was previously held for sale ($23 million),
partially offset by higher benefit expenses, including the 2002
charge for voluntary retirement programs ($60 million). On a pro
forma basis, operating companies income also increased 3.3%,
driven by favorable margins and higher volume/mix, partially
offset by higher benefit expenses.
Biscuits, Snacks and Confectionery: Reported volume in 2002
increased 0.8% over 2001. On a pro forma basis, volume in 2002
increased 0.7% over 2001, as volume gains in biscuits and snacks
were partially offset by a decline in confectionery shipments. In
biscuits, volume increased, driven by new product initiatives in
both cookies and crackers. In snacks, volume also increased,
due primarily to promotional initiatives. Confectionery volume
declined, resulting primarily from competitive activity in the breath
freshening category, partially offset by new product introductions
in the non-chocolate confectionery business.
33