Kraft 2002 Annual Report Download - page 36
Download and view the complete annual report
Please find page 36 of the 2002 Kraft annual report below. You can navigate through the pages in the report by either clicking on the pages listed below, or by using the keyword search tool below to find specific information within the annual report.-
 1
1 -
2
-
3
-
4
-
5
-
6
-
7
-
8
-
9
-
10
-
11
-
12
-
13
-
14
-
15
-
16
-
17
-
18
-
19
-
20
-
21
-
22
-
23
-
24
-
25
-
 26
26 -
 27
27 -
 28
28 -
 29
29 -
 30
30 -
 31
31 -
 32
32 -
 33
33 -
 34
34 -
 35
35 -
 36
36 -
 37
37 -
 38
38 -
 39
39 -
 40
40 -
 41
41 -
 42
42 -
 43
43 -
 44
44 -
 45
45 -
 46
46 -
47
-
48
-
49
-
50
-
51
-
52
-
53
-
54
-
55
-
56
-
57
-
58
-
59
-
60
-
61
-
62
-
63
-
64
-
65
-
66
-
67
-
68
-
69
-
70
 |
 |

kraft foods inc. management’s discussion and analysis of financial condition and results of operations
elimination of substantially all goodwill amortization. Reported
net earnings of $3,394 million for 2002 increased $1,512 million
(80.3%) over 2001. On a pro forma basis, diluted and basic EPS,
which were both $2.02 for 2002, increased by 15.4% over 2001,
due primarily to growth in operating companies income and
lower interest expense. On a pro forma basis, net earnings of
$3,505 million for 2002 increased $463 million (15.2%) over 2001.
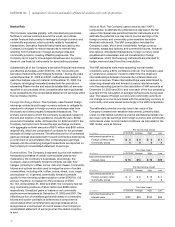
2001 compared with 2000
Reported volume for 2001 increased 4,262 million pounds
(32.5%) over 2000, due primarily to the acquisition of Nabisco.
Pro forma volume increased 2.2% over 2000. Excluding the
53rd week of shipments in 2000, volume increased 3.4%,
reflecting new product introductions and volume gains in
developing markets.
Reported net revenues for 2001 increased $6,312 million (27.5%)
over 2000, due primarily to the acquisition of Nabisco. Pro forma
net revenues decreased slightly from 2000, due primarily to the
53rd week of sales in 2000, the adverse effect of currency
exchange rates and lower sales prices on coffee products (driven
by commodity-related price declines), partially offset by the
favorable impact of volume growth.
Reported operating companies income increased $1,280 million
(26.9%) over 2000, due primarily to the acquisition of Nabisco.
On a pro forma basis, operating companies income increased
$524 million (9.4%), driven by volume growth, productivity
savings and Nabisco synergies, partially offset by unfavorable
currency movements.
Currency movements decreased net revenues by $493 million
and operating companies income by $60 million from 2000.
Decreases in net revenues and operating companies income were
due to the strength of the U.S. dollar against the euro, Canadian
dollar and certain Asian and Latin American currencies.
Reported interest and other debt expense, net, increased
$840 million in 2001. This increase was due primarily to notes
issued to Altria Group, Inc. in the fourth quarter of 2000 to finance
the acquisition of Nabisco. On a pro forma basis, interest and
other debt expense, net, decreased $213 million in 2001 from
$1,348 million in 2000. This decrease in pro forma interest
expense is due to the use of free cash flow to repay debt and
the refinancing of debt payable to Altria Group, Inc.
During 2001, the Company’s reported effective tax rate increased
by 4.0 percentage points to 45.4% as compared with 2000, due
primarily to higher Nabisco-related goodwill amortization, which
was not tax deductible.
Reported diluted and basic EPS, which were both $1.17 for 2001,
decreased by 15.2% from 2000, due primarily to higher levels of
goodwill amortization and interest expense associated with the
acquisition of Nabisco. Reported net earnings of $1,882 million
for 2001 decreased $119 million (5.9%) from 2000. On a pro forma
basis, diluted and basic EPS, which were both $1.75 for 2001,
increased by 12.9% over 2000, due primarily to higher operating
results in all segments. On a pro forma basis, net earnings of
$3,042 million for 2001 increased $361 million (13.5%) from 2000.
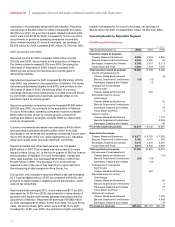
Operating Results by Reportable Segment
Kraft Foods North America
(in millions)
Year Ended December 31, 2002 2001 2000
Reported volume (in pounds):
Cheese, Meals and Enhancers 5,898 5,219 4,820
Biscuits, Snacks and Confectionery 2,369 2,350 54
Beverages, Desserts and Cereals 3,708 3,421 3,117
Oscar Mayer and Pizza 1,554 1,519 1,507
Total reported volume (in pounds) 13,529 12,509 9,498
Volume of businesses sold:
Cheese, Meals and Enhancers (5)
Biscuits, Snacks and Confectionery (15) (13)
Beverages, Desserts and Cereals (1)
Changes due to businesses
held for sale:
Cheese, Meals and Enhancers 647
Estimated impact of century
date change:
Cheese, Meals and Enhancers 16
Biscuits, Snacks and Confectionery 1
Beverages, Desserts and Cereals 19
Oscar Mayer and Pizza 5
Nabisco volume:
Cheese, Meals and Enhancers 1,101
Biscuits, Snacks and Confectionery 2,246
Beverages, Desserts and Cereals 40
Pro forma volume (in pounds) 13,514 13,142 12,921
Reported net revenues:
Cheese, Meals and Enhancers $ 8,877 $ 8,732 $ 7,923
Biscuits, Snacks and Confectionery 5,182 5,071 293
Beverages, Desserts and Cereals 4,412 4,237 4,267
Oscar Mayer and Pizza 3,014 2,930 2,829
Total reported net revenues 21,485 20,970 15,312
Net revenues of businesses sold:
Cheese, Meals and Enhancers (10)
Biscuits, Snacks and Confectionery (21) (19)
Beverages, Desserts and Cereals (12)
Changes due to businesses
held for sale:
Cheese, Meals and Enhancers 252
Estimated impact of century
date change:
Cheese, Meals and Enhancers 29
Biscuits, Snacks and Confectionery 3
Beverages, Desserts and Cereals 16
Oscar Mayer and Pizza 11
Nabisco net revenues:
Cheese, Meals and Enhancers 1,016
Biscuits, Snacks and Confectionery 4,653
Beverages, Desserts and Cereals 79
Pro forma net revenues $21,464 $21,191 $21,109
32