Kraft 2002 Annual Report Download - page 34
Download and view the complete annual report
Please find page 34 of the 2002 Kraft annual report below. You can navigate through the pages in the report by either clicking on the pages listed below, or by using the keyword search tool below to find specific information within the annual report.-
 1
1 -
2
-
3
-
4
-
5
-
6
-
7
-
8
-
9
-
10
-
11
-
12
-
13
-
14
-
15
-
16
-
17
-
18
-
19
-
20
-
21
-
22
-
23
-
 24
24 -
 25
25 -
 26
26 -
 27
27 -
 28
28 -
 29
29 -
 30
30 -
 31
31 -
 32
32 -
 33
33 -
 34
34 -
 35
35 -
 36
36 -
 37
37 -
 38
38 -
 39
39 -
 40
40 -
 41
41 -
 42
42 -
 43
43 -
 44
44 -
45
-
46
-
47
-
48
-
49
-
50
-
51
-
52
-
53
-
54
-
55
-
56
-
57
-
58
-
59
-
60
-
61
-
62
-
63
-
64
-
65
-
66
-
67
-
68
-
69
-
70
 |
 |

30
kraft foods inc. management’s discussion and analysis of financial condition and results of operations
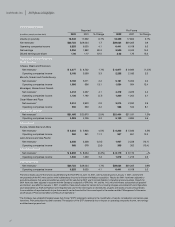
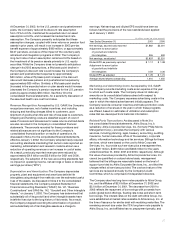
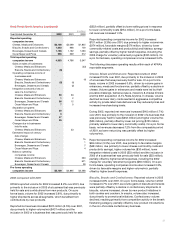
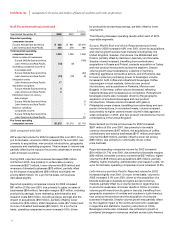
The following is a reconciliation of reported operating results to
pro forma operating results:
(in millions)
Year Ended December 31, 2002 2001 2000
Reported volume (in pounds) 18,549 17,392 13,130
Volume of businesses sold (150) (187) (82)
Changes due to businesses
held for sale 647
Estimated impact of century
date change 55
Nabisco volume 4,367
Pro forma volume (in pounds) 18,399 17,852 17,470
Reported net revenues $29,723 $29,234 $22,922
Net revenues of businesses sold (89) (121) (162)
Changes due to businesses
held for sale 252
Estimated impact of century
date change 85
Nabisco net revenues 6,822
Pro forma net revenues $29,634 $29,365 $29,667
Reported operating
companies income $ 6,283 $ 6,035 $ 4,755
Gains on sales of businesses (80) (8) (172)
Operating companies income of
businesses sold (15) (24) (39)
Integration costs and a loss on
sale of a food factory 111 82
Separation programs 142
Changes due to businesses
held for sale 23
Estimated impact of century
date change 40
Nabisco operating
companies income 1,000
Pro forma operating
companies income $ 6,441 $ 6,108 $ 5,584
Reported net earnings $ 3,394 $ 1,882 $ 2,001
After-tax effect of:
Integration costs and a loss
on sale of a food factory 72 45
Separation programs 91
Gains on sales of businesses (52) (5) (101)
Cessation of goodwill and
indefinite life intangible
asset amortization 955 530
Nabisco results (135)
Interest reduction assuming
full-year IPO 165 363
Estimated impact of century
date change 23
Pro forma net earnings $ 3,505 $ 3,042 $ 2,681
Average diluted shares outstanding 1,736 1,610 1,455
Adjustment to reflect shares
outstanding after IPO 125 280
Pro forma diluted shares outstanding 1,736 1,735 1,735
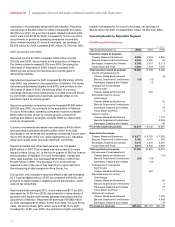
Consolidated Operating Results
(in millions)
Year Ended December 31, 2002 2001 2000
Reported volume (in pounds):
Kraft Foods North America
Cheese, Meals and Enhancers 5,898 5,219 4,820
Biscuits, Snacks and Confectionery 2,369 2,350 54
Beverages, Desserts and Cereals 3,708 3,421 3,117
Oscar Mayer and Pizza 1,554 1,519 1,507
Total Kraft Foods North America 13,529 12,509 9,498
Kraft Foods International
Europe, Middle East and Africa 2,961 2,826 2,829
Latin America and Asia Pacific 2,059 2,057 803
Total Kraft Foods International 5,020 4,883 3,632
Total reported volume 18,549 17,392 13,130
Reported net revenues:
Kraft Foods North America
Cheese, Meals and Enhancers $ 8,877 $ 8,732 $ 7,923
Biscuits, Snacks and Confectionery 5,182 5,071 293
Beverages, Desserts and Cereals 4,412 4,237 4,267
Oscar Mayer and Pizza 3,014 2,930 2,829
Total Kraft Foods North America 21,485 20,970 15,312
Kraft Foods International
Europe, Middle East and Africa 6,203 5,936 6,398
Latin America and Asia Pacific 2,035 2,328 1,212
Total Kraft Foods International 8,238 8,264 7,610
Total reported net revenues $29,723 $29,234 $22,922
Reported operating
companies income:
Kraft Foods North America
Cheese, Meals and Enhancers $ 2,168 $ 2,099 $ 1,845
Biscuits, Snacks and Confectionery 1,093 966 100
Beverages, Desserts and Cereals 1,136 1,192 1,090
Oscar Mayer and Pizza 556 539 512
Total Kraft Foods North America 4,953 4,796 3,547
Kraft Foods International
Europe, Middle East and Africa 962 861 1,019
Latin America and Asia Pacific 368 378 189
Total Kraft Foods International 1,330 1,239 1,208
Total reported operating
companies income $ 6,283 $ 6,035 $ 4,755